Estimated Value: $561,000 - $600,445
3
Beds
2
Baths
884
Sq Ft
$653/Sq Ft
Est. Value
About This Home
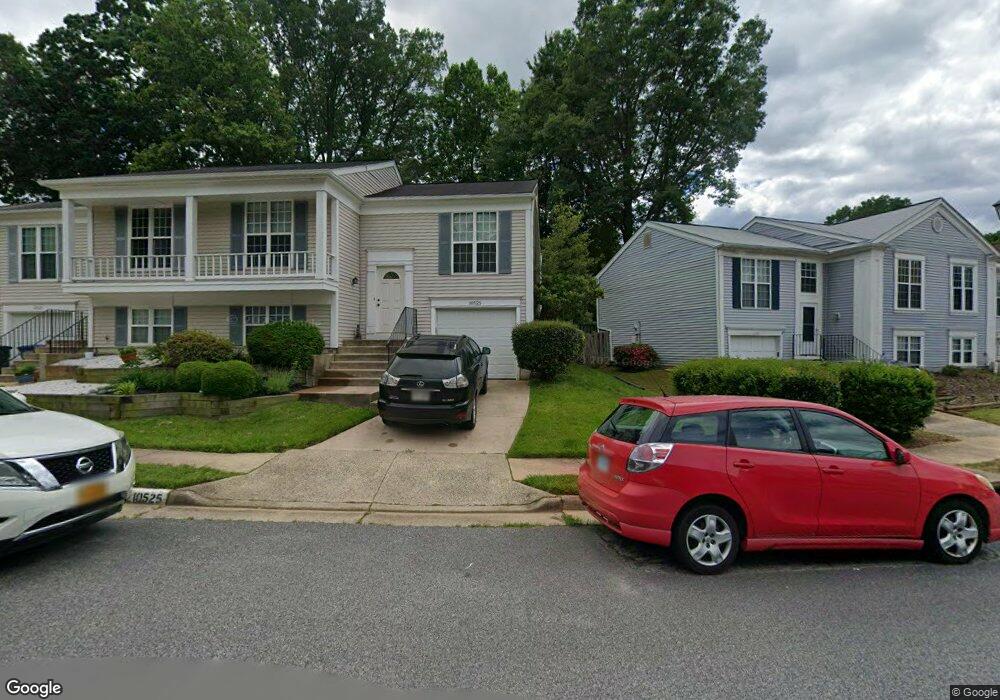
This home is located at 10525 Reeds Landing Cir, Burke, VA 22015 and is currently estimated at $577,111, approximately $652 per square foot. 10525 Reeds Landing Cir is a home located in Fairfax County with nearby schools including Fairview Elementary School, James W Robinson, Jr. Secondary School, and Fairfax Baptist Temple Academy.
Ownership History
Date
Name
Owned For
Owner Type
Purchase Details
Closed on
Nov 17, 2022
Sold by
Tombillo Carol and Tombillo Nicholas
Bought by
Tombillo Carol
Current Estimated Value
Purchase Details
Closed on
Jan 5, 2021
Sold by
Tombillo Carol and Grover William
Bought by
Tombillo Carol and Tombillo Nicholas
Home Financials for this Owner
Home Financials are based on the most recent Mortgage that was taken out on this home.
Original Mortgage
$682,500
Interest Rate
2.98%
Mortgage Type
Reverse Mortgage Home Equity Conversion Mortgage
Purchase Details
Closed on
Oct 10, 2003
Sold by
Davis Charles S
Bought by
Grover Wiliam
Purchase Details
Closed on
Oct 8, 1993
Sold by
Merrill B Q
Bought by
Davis Charles S
Home Financials for this Owner
Home Financials are based on the most recent Mortgage that was taken out on this home.
Original Mortgage
$135,350
Interest Rate
6.9%
Create a Home Valuation Report for This Property
The Home Valuation Report is an in-depth analysis detailing your home's value as well as a comparison with similar homes in the area
Home Values in the Area
Average Home Value in this Area
Purchase History
| Date | Buyer | Sale Price | Title Company |
|---|---|---|---|
| Tombillo Carol | -- | -- | |
| Tombillo Carol | -- | Accommodation | |
| Grover Wiliam | $270,000 | -- | |
| Davis Charles S | $142,500 | -- |
Source: Public Records
Mortgage History
| Date | Status | Borrower | Loan Amount |
|---|---|---|---|
| Previous Owner | Tombillo Carol | $682,500 | |
| Previous Owner | Davis Charles S | $135,350 |
Source: Public Records
Tax History Compared to Growth
Tax History
| Year | Tax Paid | Tax Assessment Tax Assessment Total Assessment is a certain percentage of the fair market value that is determined by local assessors to be the total taxable value of land and additions on the property. | Land | Improvement |
|---|---|---|---|---|
| 2025 | $5,693 | $533,680 | $220,000 | $313,680 |
| 2024 | $5,693 | $491,440 | $200,000 | $291,440 |
| 2023 | $5,433 | $481,440 | $190,000 | $291,440 |
| 2022 | $4,949 | $432,790 | $180,000 | $252,790 |
| 2021 | $4,968 | $423,360 | $170,000 | $253,360 |
| 2020 | $4,736 | $400,140 | $160,000 | $240,140 |
| 2019 | $4,539 | $383,490 | $150,000 | $233,490 |
| 2018 | $4,267 | $371,020 | $150,000 | $221,020 |
| 2017 | $3,927 | $338,200 | $125,000 | $213,200 |
| 2016 | $3,918 | $338,200 | $125,000 | $213,200 |
| 2015 | $3,774 | $338,200 | $125,000 | $213,200 |
| 2014 | $3,655 | $328,200 | $115,000 | $213,200 |
Source: Public Records
Map
Nearby Homes
- 6154 Martins Landing Ct
- 6115 Martins Landing Ct
- 5932 Cove Landing Rd Unit 101
- 5924 Cove Landing Rd Unit 301
- 5918 Cove Landing Rd Unit 204
- 5837 Cove Landing Rd Unit 101
- 5806 Cove Landing Rd Unit 304
- 5811 Cove Landing Rd Unit 301
- 5976 Annaberg Place Unit 168
- 10330 Luria Commons Ct Unit 1B
- 6105 Heron Pond Ct
- 10205 Quiet Pond Terrace
- 12287 Wye Oak Commons Cir
- 12210 Wye Oak Commons Cir
- 6108 Pond Lily Ct
- 5816 Oak Leather Dr
- 10139 Wood Green Way
- 10676 Myrtle Oak Ct
- 6220 Winslow Ct
- 5809 Wood Poppy Ct
- 10527 Reeds Landing Cir
- 10523 Reeds Landing Cir
- 10519 Reeds Landing Cir
- 10529 Reeds Landing Cir
- 10517 Reeds Landing Cir
- 5959 Powells Landing Rd
- 5961 Powells Landing Rd
- 10515 Reeds Landing Cir
- 10531 Reeds Landing Cir
- 5963 Powells Landing Rd
- 10524 Reeds Landing Cir
- 10526 Reeds Landing Cir
- 10528 Reeds Landing Cir
- 10530 Reeds Landing Cir
- 10522 Reeds Landing Cir
- 10520 Reeds Landing Cir
- 5965 Powells Landing Rd
- 10513 Reeds Landing Cir
- 10518 Reeds Landing Cir
- 10532 Reeds Landing Cir