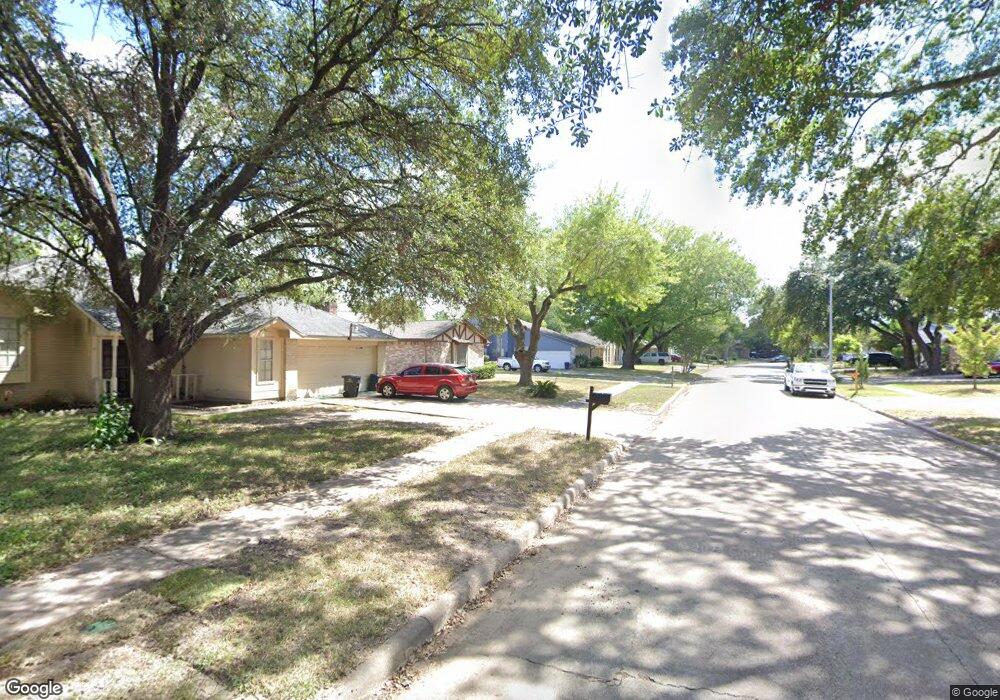
10526 Northview Dr Unit 1 Houston, TX 77086
North Houston NeighborhoodEstimated Value: $211,976 - $239,000
3
Beds
2
Baths
1,318
Sq Ft
$170/Sq Ft
Est. Value
About This Home
This home is located at 10526 Northview Dr Unit 1, Houston, TX 77086 and is currently estimated at $224,494, approximately $170 per square foot. 10526 Northview Dr Unit 1 is a home located in Harris County with nearby schools including Kujawa EC/Pre-K/K School, Carmichael Elementary School, and Shotwell Middle School.
Ownership History
Date
Name
Owned For
Owner Type
Purchase Details
Closed on
May 9, 2003
Sold by
Hud
Bought by
Pena Vanessa
Current Estimated Value
Home Financials for this Owner
Home Financials are based on the most recent Mortgage that was taken out on this home.
Original Mortgage
$68,400
Outstanding Balance
$30,980
Interest Rate
6.37%
Mortgage Type
Purchase Money Mortgage
Estimated Equity
$193,514
Purchase Details
Closed on
Jan 14, 2003
Sold by
Countrywide Homes Loans Inc
Bought by
Hud
Purchase Details
Closed on
Jan 7, 2003
Sold by
Sanchez Jose Luis
Bought by
Countrywide Home Loans Inc
Purchase Details
Closed on
Oct 14, 1999
Sold by
Hardesty William E and Hardesty Patti S
Bought by
Sanchez Jose Luis
Home Financials for this Owner
Home Financials are based on the most recent Mortgage that was taken out on this home.
Original Mortgage
$68,800
Interest Rate
7.9%
Mortgage Type
FHA
Create a Home Valuation Report for This Property
The Home Valuation Report is an in-depth analysis detailing your home's value as well as a comparison with similar homes in the area
Home Values in the Area
Average Home Value in this Area
Purchase History
| Date | Buyer | Sale Price | Title Company |
|---|---|---|---|
| Pena Vanessa | -- | First American Title | |
| Hud | -- | -- | |
| Countrywide Home Loans Inc | $74,226 | -- | |
| Sanchez Jose Luis | -- | Stewart Title |
Source: Public Records
Mortgage History
| Date | Status | Borrower | Loan Amount |
|---|---|---|---|
| Open | Pena Vanessa | $68,400 | |
| Previous Owner | Sanchez Jose Luis | $68,800 |
Source: Public Records
Tax History Compared to Growth
Tax History
| Year | Tax Paid | Tax Assessment Tax Assessment Total Assessment is a certain percentage of the fair market value that is determined by local assessors to be the total taxable value of land and additions on the property. | Land | Improvement |
|---|---|---|---|---|
| 2025 | $2,904 | $212,967 | $40,223 | $172,744 |
| 2024 | $2,904 | $212,967 | $40,223 | $172,744 |
| 2023 | $2,904 | $219,913 | $40,223 | $179,690 |
| 2022 | $3,630 | $184,956 | $34,088 | $150,868 |
| 2021 | $3,400 | $140,000 | $34,088 | $105,912 |
| 2020 | $3,327 | $140,097 | $34,088 | $106,009 |
| 2019 | $3,145 | $134,310 | $17,364 | $116,946 |
| 2018 | $1,103 | $127,232 | $17,364 | $109,868 |
| 2017 | $2,506 | $119,097 | $15,593 | $103,504 |
| 2016 | $2,278 | $108,023 | $15,593 | $92,430 |
| 2015 | $1,598 | $101,852 | $15,593 | $86,259 |
| 2014 | $1,598 | $76,336 | $15,593 | $60,743 |
Source: Public Records
Map
Nearby Homes
- 10522 Northview Dr
- 6615 Winding Trace Dr
- 6502 Trail Valley Way
- 6630 Brownie Campbell Rd
- 6654 Brownie Campbell Rd
- 6722 Winding Trace Dr
- 6610 Northleaf Dr
- 13610 Kaltenbrun Rd
- 13518 Kaltenbrun Rd
- 10306 Jillana Kaye Dr
- 11009 Panicum Ct
- 6606 Dusty Dawn Dr
- 11006 Crinkleawn Dr
- 11021 Crenchrus Ct
- 10214 Trade Winds Dr
- 6911 Silver Star Dr
- 7002 Sandswept Ln
- 6822 Dusty Dawn Dr
- 6703 Deer Ridge Ln
- 11007 Tobasa Ct
- 10526 Northview Dr
- 10530 Northview Dr
- 10518 Northview Dr
- 10534 Northview Dr
- 10527 Northview Dr
- 10523 Northview Dr
- 10514 Northview Dr
- 6602 Winding Trace Dr
- 10519 Northview Dr
- 6607 Winding Trace Dr
- 6603 Canyon Way Dr
- 10510 Northview Dr
- 6606 Winding Trace Dr
- 10515 Northview Dr
- 6607 Canyon Way Dr
- 6611 Winding Trace Dr
- 10514 Trade Winds Dr
- 6611 Canyon Way Dr
- 6610 Winding Trace Dr
- 10511 Northview Dr