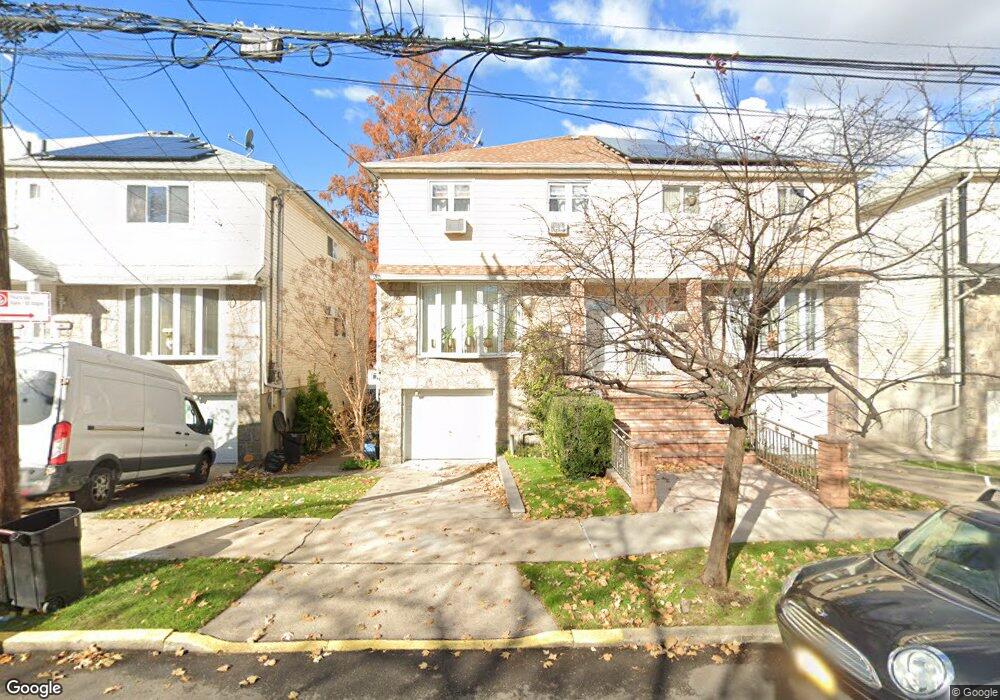
10529 Flatlands 3rd St Brooklyn, NY 11236
Canarsie NeighborhoodEstimated Value: $788,000 - $871,000
Studio
--
Bath
2,310
Sq Ft
$359/Sq Ft
Est. Value
About This Home
This home is located at 10529 Flatlands 3rd St, Brooklyn, NY 11236 and is currently estimated at $829,725, approximately $359 per square foot. 10529 Flatlands 3rd St is a home located in Kings County with nearby schools including P.S. 279 Herman Schreiber, I.S. 211 John Wilson, and Canarsie Ascend Charter School.
Ownership History
Date
Name
Owned For
Owner Type
Purchase Details
Closed on
Nov 21, 2024
Sold by
Channer Donovan and Channer Jacqueline
Bought by
Holland Marja and Holland James Ida
Current Estimated Value
Home Financials for this Owner
Home Financials are based on the most recent Mortgage that was taken out on this home.
Original Mortgage
$785,510
Outstanding Balance
$776,630
Interest Rate
6.44%
Mortgage Type
Purchase Money Mortgage
Estimated Equity
$53,095
Purchase Details
Closed on
Feb 10, 2004
Sold by
Krushevsky Ester and Krushevsky Mikhail
Bought by
Channer Donovan and Channer Jacqueline
Home Financials for this Owner
Home Financials are based on the most recent Mortgage that was taken out on this home.
Original Mortgage
$333,700
Interest Rate
5.65%
Mortgage Type
Purchase Money Mortgage
Create a Home Valuation Report for This Property
The Home Valuation Report is an in-depth analysis detailing your home's value as well as a comparison with similar homes in the area
Home Values in the Area
Average Home Value in this Area
Purchase History
| Date | Buyer | Sale Price | Title Company |
|---|---|---|---|
| Holland Marja | $800,000 | -- | |
| Holland Marja | $800,000 | -- | |
| Channer Donovan | $369,000 | -- | |
| Channer Donovan | $369,000 | -- |
Source: Public Records
Mortgage History
| Date | Status | Borrower | Loan Amount |
|---|---|---|---|
| Open | Holland Marja | $785,510 | |
| Closed | Holland Marja | $785,510 | |
| Previous Owner | Channer Donovan | $333,700 |
Source: Public Records
Tax History
| Year | Tax Paid | Tax Assessment Tax Assessment Total Assessment is a certain percentage of the fair market value that is determined by local assessors to be the total taxable value of land and additions on the property. | Land | Improvement |
|---|---|---|---|---|
| 2025 | $6,880 | $57,960 | $13,080 | $44,880 |
| 2024 | $6,880 | $64,140 | $13,080 | $51,060 |
| 2023 | $6,897 | $56,400 | $13,080 | $43,320 |
| 2022 | $6,341 | $50,580 | $13,080 | $37,500 |
| 2021 | $5,954 | $39,060 | $13,080 | $25,980 |
| 2020 | $2,754 | $34,920 | $13,080 | $21,840 |
| 2019 | $5,511 | $34,920 | $13,080 | $21,840 |
| 2018 | $5,308 | $32,299 | $9,606 | $22,693 |
| 2017 | $5,324 | $30,471 | $12,439 | $18,032 |
| 2016 | $4,854 | $28,747 | $10,273 | $18,474 |
| 2015 | $3,171 | $27,120 | $10,920 | $16,200 |
| 2014 | $3,171 | $27,120 | $10,920 | $16,200 |
Source: Public Records
Map
Nearby Homes
- 10530 Avenue K
- 1125 E 104th St
- 1060 E 105th St
- 1054 E 105th St
- 1041 E 104th St
- 10224 Avenue K
- 1115 E 102nd St
- 10716 Avenue J
- 1235 E 104th St
- 982 E 106th St
- 1011 E 108th St Unit 1D
- 1131 E 101st St
- 1052 E 102nd St
- 989 E 108th St Unit BB
- 1161 E 101st St
- 10210 Avenue J
- 979 E 108th St Unit 1B
- 966 E 104th St
- 944 E 106th St
- 1118 E 101st St
- 10523 Flatlands 3rd St
- 10531 Flatlands 3rd St
- 10521 Flatlands 3rd St
- 10535 Flatlands 3rd St
- 10517 Flatlands 3rd St
- 10537 Flatlands 3rd St
- 10526 Avenue K
- 10528 Avenue K
- 10528 Avenue K Unit 2
- 10515 Flatlands 3rd St
- 10541 Flatlands 3rd St
- 10522 Avenue K
- 10532 Avenue K
- 10520 Avenue K
- 10536 Avenue K
- 10518 Avenue K
- 10543 Flatlands 3rd St
- 10538 Avenue K
- 10516 Avenue K
Your Personal Tour Guide
Ask me questions while you tour the home.