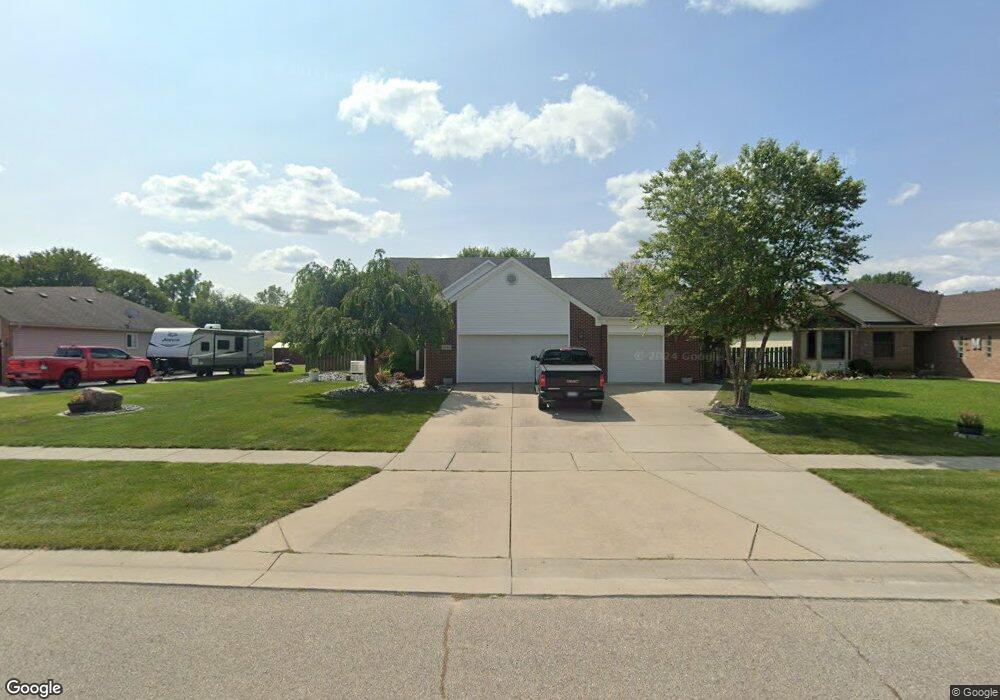
1053 Broad ax Ln Smiths Creek, MI 48074
Estimated Value: $284,000 - $371,000
3
Beds
2
Baths
1,698
Sq Ft
$187/Sq Ft
Est. Value
About This Home
This home is located at 1053 Broad ax Ln, Smiths Creek, MI 48074 and is currently estimated at $317,299, approximately $186 per square foot. 1053 Broad ax Ln is a home located in St. Clair County with nearby schools including Kimball Elementary School, Central Middle School, and Port Huron High School.
Ownership History
Date
Name
Owned For
Owner Type
Purchase Details
Closed on
Jun 22, 2006
Sold by
Nielsen Gilbert and Nielsen Karene M
Bought by
Nielsen Kim K
Current Estimated Value
Home Financials for this Owner
Home Financials are based on the most recent Mortgage that was taken out on this home.
Original Mortgage
$180,000
Interest Rate
6.73%
Mortgage Type
New Conventional
Purchase Details
Closed on
Jul 19, 2005
Sold by
Wolverine Custom Builders Llc
Bought by
Nielsen Gilbert
Purchase Details
Closed on
Jul 11, 2005
Sold by
Chesterfield Ventures Llc
Bought by
Chesterfield Homes Llc and The Wolverine Custom Homes Llc
Purchase Details
Closed on
Nov 11, 2004
Sold by
Chester Homes Llc
Bought by
Wolverine Custom Builders Llc
Create a Home Valuation Report for This Property
The Home Valuation Report is an in-depth analysis detailing your home's value as well as a comparison with similar homes in the area
Home Values in the Area
Average Home Value in this Area
Purchase History
| Date | Buyer | Sale Price | Title Company |
|---|---|---|---|
| Nielsen Kim K | -- | None Available | |
| Nielsen Gilbert | $190,000 | None Available | |
| Chesterfield Homes Llc | $36,000 | None Available | |
| Chesterfield Homes Llc | -- | None Available | |
| Wolverine Custom Builders Llc | -- | None Available |
Source: Public Records
Mortgage History
| Date | Status | Borrower | Loan Amount |
|---|---|---|---|
| Closed | Nielsen Kim K | $180,000 |
Source: Public Records
Tax History Compared to Growth
Tax History
| Year | Tax Paid | Tax Assessment Tax Assessment Total Assessment is a certain percentage of the fair market value that is determined by local assessors to be the total taxable value of land and additions on the property. | Land | Improvement |
|---|---|---|---|---|
| 2025 | $2,686 | $145,900 | $0 | $0 |
| 2024 | $1,431 | $150,300 | $0 | $0 |
| 2023 | $1,311 | $142,200 | $0 | $0 |
| 2022 | $2,420 | $129,400 | $0 | $0 |
| 2021 | $2,195 | $122,600 | $0 | $0 |
| 2020 | $2,195 | $109,300 | $109,300 | $0 |
| 2019 | $2,160 | $105,300 | $0 | $0 |
| 2018 | $2,115 | $95,700 | $0 | $0 |
| 2017 | $2,071 | $92,200 | $0 | $0 |
| 2016 | $1,067 | $92,200 | $0 | $0 |
| 2015 | -- | $90,300 | $90,300 | $0 |
| 2014 | -- | $75,700 | $75,700 | $0 |
| 2013 | -- | $73,800 | $0 | $0 |
Source: Public Records
Map
Nearby Homes
- 1091 Allen Rd
- 5117 Ravenswood Rd
- 0 Ravenswood Rd Unit 20251017048
- 0000 Ravenswood Rd
- 1604 Allen Rd
- 183 Nevada Ave
- 4745 Smiths Creek Rd
- 250 Oregon Ave
- 1701 Allen Rd
- V/L Allen
- 00 Range Rd
- 000 Montana Ave
- 42 Liberty Ave
- 1405 Range Rd
- 174 Meadow Ln
- 0000 Wisconsin Ave
- 277 Liberty Ave
- 153 Meadow Ln
- 260 Capitol Dr
- 104 Oldbrook Ln
- 1063 Broad ax Ln
- 1049 Broad ax Ln
- 1107 Broad ax Ln
- 1111 Broad ax Ln
- 1037 Broad ax Ln
- 1071 Broad ax Ln
- 1056 Allen Rd
- 1060 Allen Rd
- 1050 Allen Rd
- 1066 Allen Rd
- 1048 Broad ax Ln
- 1073 Broad ax Ln Unit Bldg-Unit
- 1073 Broad ax Ln
- 1029 Broad ax Ln
- 1038 Broad ax Ln
- 1054 Broad ax Ln
- 1044 Allen Rd
- 1028 Broad ax Ln
- 1060 Broad ax Ln
- 1070 Allen Rd