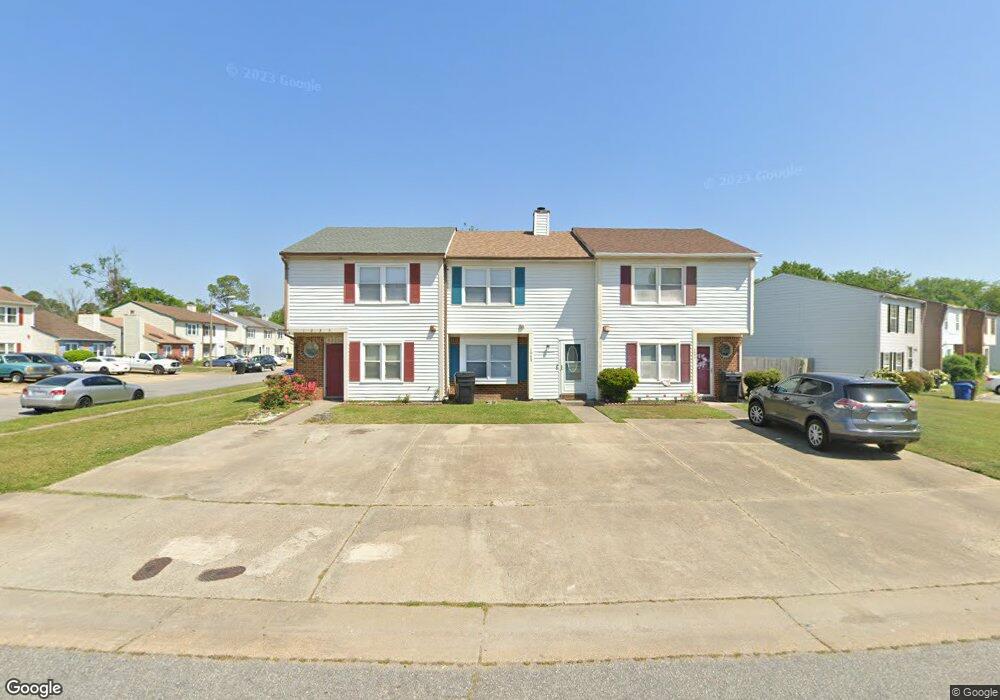
1053 Bryce Ln Virginia Beach, VA 23464
Level Green NeighborhoodEstimated Value: $254,000 - $262,000
3
Beds
2
Baths
1,302
Sq Ft
$198/Sq Ft
Est. Value
About This Home
This home is located at 1053 Bryce Ln, Virginia Beach, VA 23464 and is currently estimated at $257,475, approximately $197 per square foot. 1053 Bryce Ln is a home located in Virginia Beach City with nearby schools including College Park Elementary School, Brandon Middle School, and Tallwood High School.
Ownership History
Date
Name
Owned For
Owner Type
Purchase Details
Closed on
Aug 27, 2018
Sold by
Hf Enterprise Llc
Bought by
Ferebee Mary
Current Estimated Value
Home Financials for this Owner
Home Financials are based on the most recent Mortgage that was taken out on this home.
Original Mortgage
$143,159
Outstanding Balance
$124,328
Interest Rate
4.5%
Mortgage Type
FHA
Estimated Equity
$133,147
Purchase Details
Closed on
Jun 24, 2016
Sold by
Equity Trustees Llc A Virginia Limited L and Christmas Curtis T
Bought by
Hf Enterprise Llc
Purchase Details
Closed on
Dec 30, 2008
Sold by
Commonwealth Investments
Bought by
Christmas Curtis T
Purchase Details
Closed on
Apr 8, 2002
Sold by
Smith Bert N
Bought by
Level Green Subdiv Trust
Purchase Details
Closed on
Feb 27, 2001
Sold by
Stewart Philip M
Bought by
Smith Bert N and Kane,Crystal L
Home Financials for this Owner
Home Financials are based on the most recent Mortgage that was taken out on this home.
Original Mortgage
$63,995
Interest Rate
7%
Create a Home Valuation Report for This Property
The Home Valuation Report is an in-depth analysis detailing your home's value as well as a comparison with similar homes in the area
Home Values in the Area
Average Home Value in this Area
Purchase History
| Date | Buyer | Sale Price | Title Company |
|---|---|---|---|
| Ferebee Mary | $145,800 | Priority Title & Escrow Llc | |
| Hf Enterprise Llc | $84,100 | None Available | |
| Christmas Curtis T | $156,000 | -- | |
| Level Green Subdiv Trust | $63,000 | -- | |
| Smith Bert N | $65,000 | -- |
Source: Public Records
Mortgage History
| Date | Status | Borrower | Loan Amount |
|---|---|---|---|
| Open | Ferebee Mary | $143,159 | |
| Previous Owner | Smith Bert N | $63,995 |
Source: Public Records
Tax History Compared to Growth
Tax History
| Year | Tax Paid | Tax Assessment Tax Assessment Total Assessment is a certain percentage of the fair market value that is determined by local assessors to be the total taxable value of land and additions on the property. | Land | Improvement |
|---|---|---|---|---|
| 2025 | $2,206 | $240,000 | $85,000 | $155,000 |
| 2024 | $2,206 | $227,400 | $85,000 | $142,400 |
| 2023 | $1,952 | $197,200 | $68,000 | $129,200 |
| 2022 | $1,737 | $175,500 | $60,000 | $115,500 |
| 2021 | $1,524 | $153,900 | $50,000 | $103,900 |
| 2020 | $1,465 | $144,000 | $45,000 | $99,000 |
| 2019 | $1,435 | $141,000 | $45,000 | $96,000 |
| 2018 | $1,414 | $141,000 | $45,000 | $96,000 |
| 2017 | $1,311 | $130,800 | $45,000 | $85,800 |
| 2016 | $1,211 | $122,300 | $45,000 | $77,300 |
| 2015 | $1,211 | $122,300 | $45,000 | $77,300 |
| 2014 | $915 | $108,000 | $49,000 | $59,000 |
Source: Public Records
Map
Nearby Homes
- 1066 Commonwealth Place
- 1031 Bryce Ln
- 1027 Bryce Ln
- 1001 Commonwealth Place
- 1052 Lockwood Ct
- 5966 Edgelake Dr
- 1213 Clydesdale Ln
- 5809 Beechwalk Dr
- 1240 Clydesdale Ln
- 1183 Meadow Sage Ln
- 5872 Connors Dr
- 808 Raymond Ct
- 6344 Bucknell Cir
- 1257 Glyndon Dr
- 6415 Duquesne Place
- 1241 Glyndon Dr
- 729 Howell St
- 805 Woodstock Rd
- 928 Redwood Cir
- 6464 Duquesne Place
- 1055 Bryce Ln
- 1051 Bryce Ln
- 1068 Commonwealth Place
- 1039 Bryce Ln
- 1035 Bryce Ln
- 1064 Commonwealth Place
- 1077 Commonwealth Place
- 1075 Commonwealth Place
- 1073 Commonwealth Place
- 1079 Commonwealth Place
- 1071 Commonwealth Place
- 1081 Commonwealth Place
- 1069 Commonwealth Place
- 1083 Commonwealth Place
- 1062 Commonwealth Place
- 1054 Bryce Ln Unit Ln
- 1054 Bryce Ln
- 1056 Bryce Ln
- 1058 Bryce Ln
- 1050 Bryce Ln