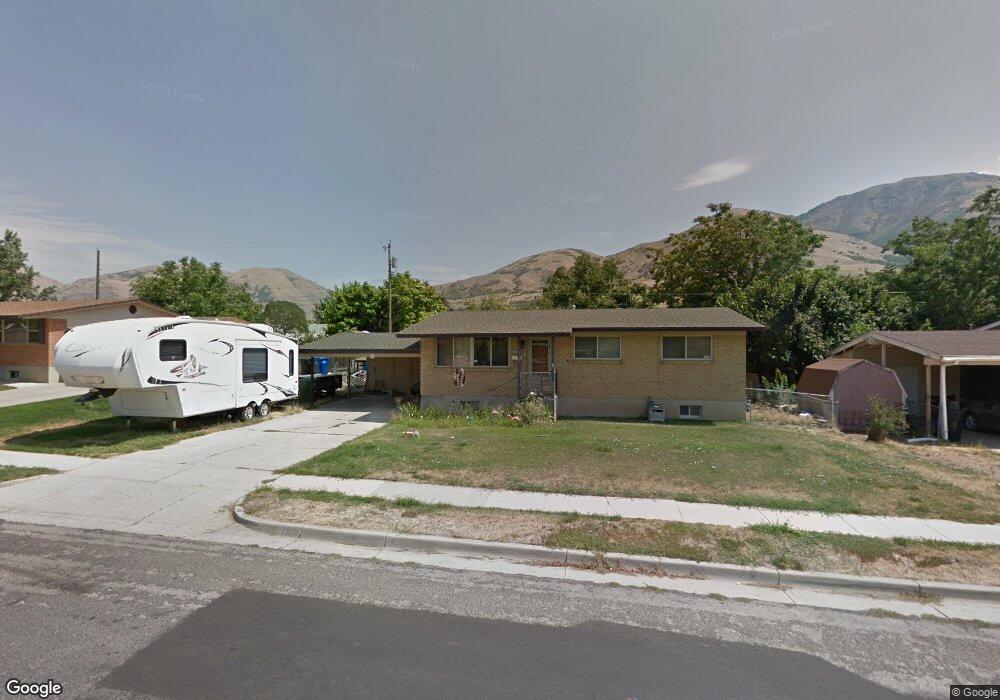
1053 Grandview Dr Brigham City, UT 84302
Estimated Value: $359,000 - $522,000
5
Beds
2
Baths
2,240
Sq Ft
$186/Sq Ft
Est. Value
About This Home
This home is located at 1053 Grandview Dr, Brigham City, UT 84302 and is currently estimated at $415,939, approximately $185 per square foot. 1053 Grandview Dr is a home located in Box Elder County with nearby schools including Lake View Elementary School, Adele C. Young Intermediate School, and Box Elder Middle School.
Ownership History
Date
Name
Owned For
Owner Type
Purchase Details
Closed on
Jan 10, 2025
Sold by
Kruger Living Trust and Kruger Nathan
Bought by
Kruger Nathan and Kruger Katherine
Current Estimated Value
Purchase Details
Closed on
Jul 6, 2021
Sold by
Kruger Nathan and Kruger Katherine
Bought by
Kruger Nathan and Kruger Katherine
Purchase Details
Closed on
Jun 20, 2019
Sold by
Leeuwen Gary J and Leeuwen Raylene G
Bought by
Kruger Nathan and Kruger Katherine
Home Financials for this Owner
Home Financials are based on the most recent Mortgage that was taken out on this home.
Original Mortgage
$189,012
Interest Rate
4.5%
Mortgage Type
FHA
Purchase Details
Closed on
Dec 9, 2009
Sold by
Turner Raylene G
Bought by
Leeuwen Gary J Van and Leeuwen Raylene G Van
Create a Home Valuation Report for This Property
The Home Valuation Report is an in-depth analysis detailing your home's value as well as a comparison with similar homes in the area
Home Values in the Area
Average Home Value in this Area
Purchase History
| Date | Buyer | Sale Price | Title Company |
|---|---|---|---|
| Kruger Nathan | -- | None Listed On Document | |
| Kruger Nathan | -- | None Listed On Document | |
| Kruger Nathan | -- | None Listed On Document | |
| Kruger Nathan | -- | None Available | |
| Kruger Nathan | -- | Us Title Insurance Agency | |
| Leeuwen Gary J Van | -- | -- |
Source: Public Records
Mortgage History
| Date | Status | Borrower | Loan Amount |
|---|---|---|---|
| Previous Owner | Kruger Nathan | $189,012 |
Source: Public Records
Tax History Compared to Growth
Tax History
| Year | Tax Paid | Tax Assessment Tax Assessment Total Assessment is a certain percentage of the fair market value that is determined by local assessors to be the total taxable value of land and additions on the property. | Land | Improvement |
|---|---|---|---|---|
| 2025 | $1,828 | $359,272 | $104,000 | $255,272 |
| 2024 | $1,828 | $351,837 | $99,000 | $252,837 |
| 2023 | $1,922 | $378,930 | $94,000 | $284,930 |
| 2022 | $1,889 | $190,411 | $21,450 | $168,961 |
| 2021 | $1,506 | $229,689 | $39,000 | $190,689 |
| 2020 | $1,414 | $229,689 | $39,000 | $190,689 |
| 2019 | $1,322 | $114,263 | $21,450 | $92,813 |
| 2018 | $1,188 | $102,157 | $21,450 | $80,707 |
| 2017 | $955 | $142,192 | $16,500 | $112,192 |
| 2016 | $1,000 | $75,267 | $16,500 | $58,767 |
| 2015 | $930 | $69,925 | $16,500 | $53,425 |
| 2014 | $930 | $67,381 | $16,500 | $50,881 |
| 2013 | -- | $67,381 | $16,500 | $50,881 |
Source: Public Records
Map
Nearby Homes
- 1002 Grandview Rd
- 1060 S Main St Unit 74
- 417 Skyline Dr Unit 6
- 134 Skyline Dr
- 337 Skyline Dr Unit 2
- 314 W 1550 S
- 1568 S 125 W
- 869 W 1025 S
- 165 1600 S
- 1670 S Highway 89
- 140 W Hill Haven Dr
- 770 S 400 E Unit 50
- 1542 Valley View Dr
- 641 S 500 W
- 1795 S 225 W
- 165 E 1550 S
- 562 S 300 W
- 637 E 950 S Unit 20
- 39 E 1800 S
- 1873 S 300 W Unit 19
- 1061 Grandview Dr
- 1045 Grandview Dr
- 1042 Grandview Dr
- 1042 Grandview Rd
- 1022 Lombardy St
- 43 Sumac Way
- 1033 Grandview Dr
- 1069 Grandview Dr
- 269 Linda Way
- 280 Linda Way
- 1030 Grandview Dr
- 1068 Grandview Dr
- 1018 Lombardy St
- 1029 Grandview Dr
- 277 Greenwood Dr
- 1057 Linda Way
- 294 Linda Way
- 39 Sumac Way
- 1076 Grandview Dr
- 1012 Lombardy St