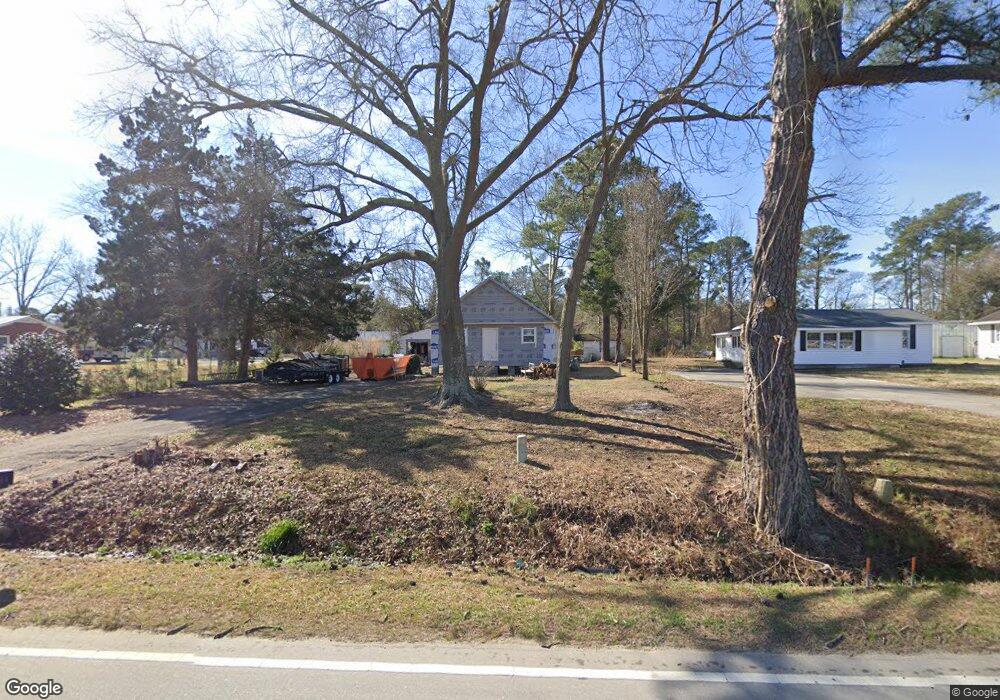
1053 Gregory Fork Rd Richlands, NC 28574
Estimated Value: $102,000 - $164,000
3
Beds
1
Bath
874
Sq Ft
$156/Sq Ft
Est. Value
About This Home
This home is located at 1053 Gregory Fork Rd, Richlands, NC 28574 and is currently estimated at $135,970, approximately $155 per square foot. 1053 Gregory Fork Rd is a home located in Onslow County with nearby schools including Richlands Elementary School, Trexler Middle School, and Richlands High School.
Ownership History
Date
Name
Owned For
Owner Type
Purchase Details
Closed on
Sep 12, 2023
Sold by
Albertson Brenda and Albertson James
Bought by
Martinez Diaz Jubentino and Diaz Josefina C
Current Estimated Value
Purchase Details
Closed on
Aug 23, 2016
Sold by
Humphrey Annie and Humphrey Anne
Bought by
Albertson Brenda and Albertson James
Purchase Details
Closed on
Jan 4, 2007
Sold by
Humphrey Morris and Humphrey Annie
Bought by
Humphrey Rodney and Humphrey Cynthia
Create a Home Valuation Report for This Property
The Home Valuation Report is an in-depth analysis detailing your home's value as well as a comparison with similar homes in the area
Home Values in the Area
Average Home Value in this Area
Purchase History
| Date | Buyer | Sale Price | Title Company |
|---|---|---|---|
| Martinez Diaz Jubentino | -- | None Listed On Document | |
| Albertson Brenda | -- | Attorney | |
| Humphrey Rodney | -- | None Available |
Source: Public Records
Tax History
| Year | Tax Paid | Tax Assessment Tax Assessment Total Assessment is a certain percentage of the fair market value that is determined by local assessors to be the total taxable value of land and additions on the property. | Land | Improvement |
|---|---|---|---|---|
| 2025 | $360 | $54,892 | $23,210 | $31,682 |
| 2024 | $360 | $54,892 | $23,210 | $31,682 |
| 2023 | $360 | $54,892 | $23,210 | $31,682 |
| 2022 | $360 | $54,892 | $23,210 | $31,682 |
| 2021 | $297 | $42,180 | $17,020 | $25,160 |
| 2020 | $297 | $42,180 | $17,020 | $25,160 |
| 2019 | $297 | $42,180 | $17,020 | $25,160 |
| 2018 | $297 | $42,180 | $17,020 | $25,160 |
| 2017 | $314 | $46,570 | $17,020 | $29,550 |
| 2016 | $314 | $46,570 | $0 | $0 |
| 2015 | $314 | $46,570 | $0 | $0 |
| 2014 | $314 | $46,570 | $0 | $0 |
Source: Public Records
Map
Nearby Homes
- 1070 Gregory Fork Rd
- 216 Trophy Ridge Dr
- 135 Dallas Dr
- 102 Buckhaven Dr
- 113 Woodwater Dr
- 133 Dallas Dr
- 132 Dallas Dr
- 318 Purple Rain Ct
- 725 Greenwich Place
- 201 Place Unit 66
- 114 Dallas Dr
- 205 Megan's Field Place
- 105 Dallas
- 101 Loyd Ln
- 306 Purple Rain Ct
- 212 Quarry Trail
- 914 Haw Branch Rd
- 580 Koonce Fork Rd
- 204 Mewborn Dr
- 334 Luther Banks Rd
- 1057 Gregory Fork Rd
- 1059 Gregory Fork Rd
- 1047 Gregory Fork Rd
- 1051 Gregory Fork Rd
- 1061 Gregory Fork Rd
- 1043 Gregory Fork Rd
- 126 Clarence Ln
- 1037 Gregory Fork Rd
- 1073 Gregory Fork Rd
- 1036 Gregory Fork Rd
- 1045 Gregory Fork Rd
- 1033 Gregory Fork Rd
- 1027 Gregory Fork Rd
- 1079 Gregory Fork Rd
- 1023 Gregory Fork Rd
- 1017 Gregory Fork Rd
- 1014 Gregory Fork Rd
- 1083 Gregory Fork Rd
- 1085 Gregory Fork Rd
- 1008 Gregory Fork Rd
Your Personal Tour Guide
Ask me questions while you tour the home.