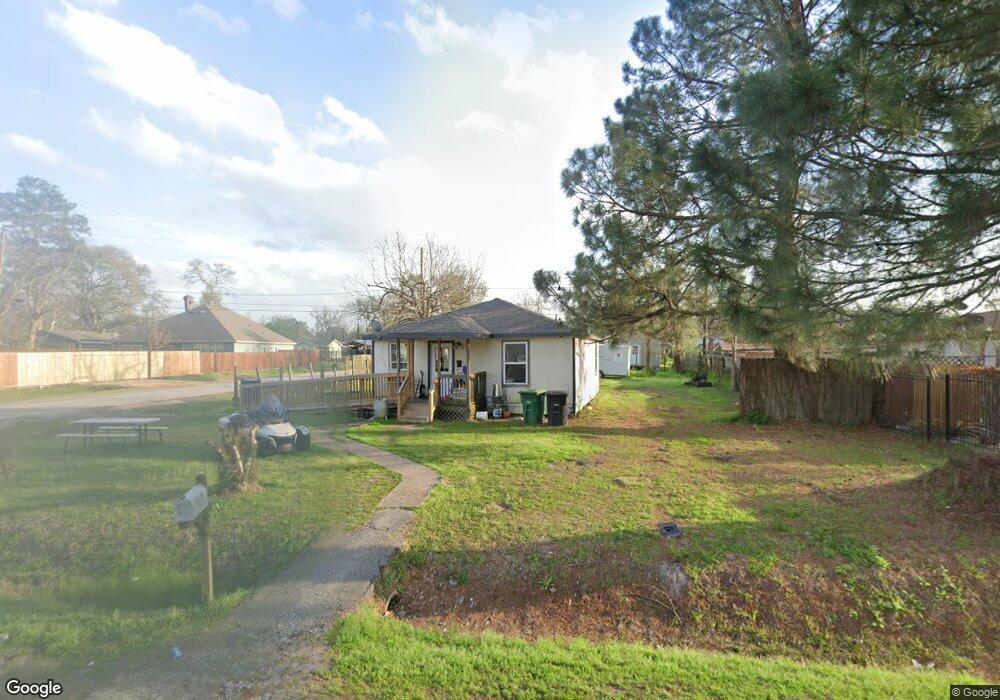
1053 Junell St Houston, TX 77088
Acres Homes NeighborhoodEstimated Value: $107,000 - $165,000
1
Bed
1
Bath
744
Sq Ft
$179/Sq Ft
Est. Value
About This Home
This home is located at 1053 Junell St, Houston, TX 77088 and is currently estimated at $133,031, approximately $178 per square foot. 1053 Junell St is a home located in Harris County with nearby schools including Osborne Elementary School, Williams Middle, and Booker T Washington Sr High.
Ownership History
Date
Name
Owned For
Owner Type
Purchase Details
Closed on
Apr 25, 2008
Sold by
Greenbriar Management Co
Bought by
Beal Louchell
Current Estimated Value
Purchase Details
Closed on
Feb 4, 2008
Sold by
U S Bank Na
Bought by
Greenbriar Management Co
Purchase Details
Closed on
Dec 4, 2007
Sold by
Conaway Kathy
Bought by
Us Bank Na and Certificateholders Citigroup Mortgage Lo
Purchase Details
Closed on
Sep 19, 2006
Sold by
Rashid Salim
Bought by
Conaway Kathy
Home Financials for this Owner
Home Financials are based on the most recent Mortgage that was taken out on this home.
Original Mortgage
$68,400
Interest Rate
9.55%
Mortgage Type
Purchase Money Mortgage
Purchase Details
Closed on
Feb 28, 2003
Sold by
Dunn Sandra
Bought by
Rashid Salim
Purchase Details
Closed on
Mar 8, 2001
Sold by
Mcdonald William
Bought by
Dunn Sandra
Create a Home Valuation Report for This Property
The Home Valuation Report is an in-depth analysis detailing your home's value as well as a comparison with similar homes in the area
Home Values in the Area
Average Home Value in this Area
Purchase History
| Date | Buyer | Sale Price | Title Company |
|---|---|---|---|
| Beal Louchell | -- | None Available | |
| Greenbriar Management Co | -- | United Title Of Texas | |
| Us Bank Na | $58,500 | None Available | |
| Conaway Kathy | -- | None Available | |
| Rashid Salim | -- | -- | |
| Dunn Sandra | -- | -- |
Source: Public Records
Mortgage History
| Date | Status | Borrower | Loan Amount |
|---|---|---|---|
| Previous Owner | Conaway Kathy | $68,400 | |
| Closed | Beal Louchell | $0 |
Source: Public Records
Tax History
| Year | Tax Paid | Tax Assessment Tax Assessment Total Assessment is a certain percentage of the fair market value that is determined by local assessors to be the total taxable value of land and additions on the property. | Land | Improvement |
|---|---|---|---|---|
| 2025 | $2,236 | $109,377 | $79,079 | $30,298 |
| 2024 | $2,236 | $106,875 | $79,079 | $27,796 |
| 2023 | $2,236 | $107,506 | $79,079 | $28,427 |
| 2022 | $2,070 | $94,017 | $61,720 | $32,297 |
| 2021 | $1,677 | $71,968 | $40,504 | $31,464 |
| 2020 | $1,574 | $65,007 | $34,718 | $30,289 |
| 2019 | $1,564 | $61,807 | $30,860 | $30,947 |
| 2018 | $1,204 | $47,656 | $18,518 | $29,138 |
| 2017 | $1,005 | $39,765 | $12,345 | $27,420 |
| 2016 | $1,005 | $39,765 | $12,345 | $27,420 |
| 2015 | $910 | $35,381 | $12,345 | $23,036 |
| 2014 | $910 | $35,381 | $12,345 | $23,036 |
Source: Public Records
Map
Nearby Homes
- 0 St Clair Unit 40573378
- 1053 Marjorie St
- 1084 Junell St
- 1035 Junell St
- 1093 Junell St
- 1052 Marjorie St
- 1050 Marjorie St
- 7217 Wheatley St
- 7805 Wheatley St
- 963 Lucky St
- 955 Lucky St
- 957 Ringold St
- 990 Wall St
- 769 Lucky St
- 955 Ringold St
- 1033 Reverend b j Lewis Dr
- 978 Saint Clair St
- 991 Reverend b j Lewis Dr
- 1067 Reverend b j Lewis Dr
- 911 Fortune St
- 1059 Junell St
- 1050 Saint Clair St
- 1063 Junell St
- 1058 Saint Clair St
- 1046 Saint Clair St
- 1056 Junell St
- 1060 Junell St
- 1047 Junell St
- 1062 Saint Clair St
- 1064 Junell St
- 1054 Junell St
- 0C St Claire
- 1041 Junell St
- 1075 Junell St
- 1066 Saint Clair St
- 1034 Saint Clair St
- 1063 Saint Clair St
- 1045 Saint Clair St
- 1081 Junell St
- 1046 Junell St
Your Personal Tour Guide
Ask me questions while you tour the home.