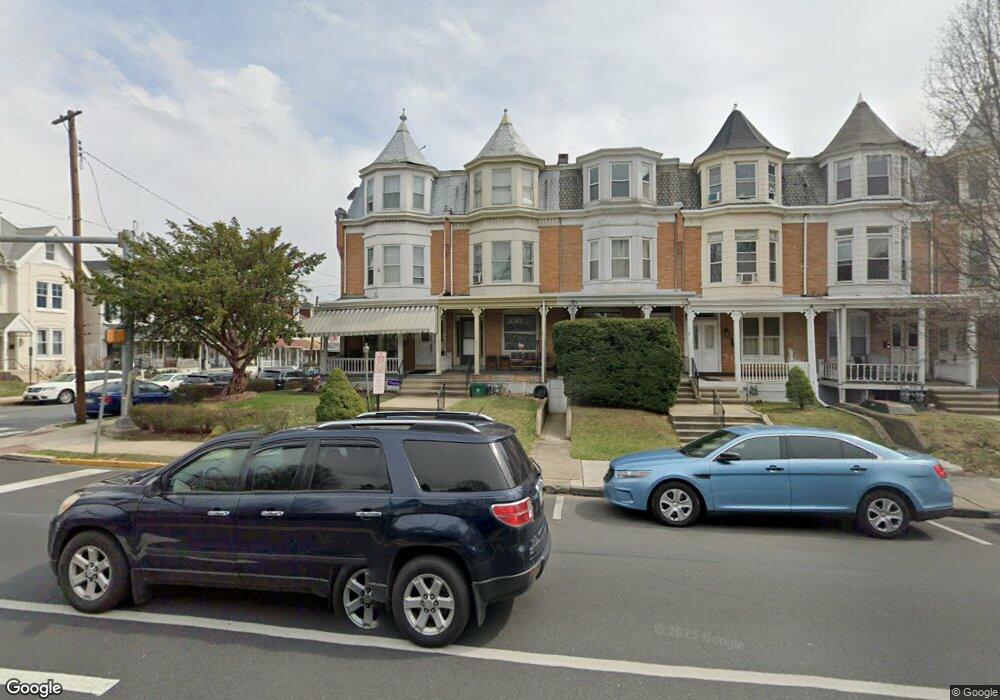
1053 N 5th St Reading, PA 19601
Estimated Value: $168,944 - $237,000
5
Beds
2
Baths
2,004
Sq Ft
$103/Sq Ft
Est. Value
About This Home
This home is located at 1053 N 5th St, Reading, PA 19601 and is currently estimated at $206,486, approximately $103 per square foot. 1053 N 5th St is a home located in Berks County with nearby schools including Riverside Elementary School, Northwest Middle School, and Reading Senior High School.
Ownership History
Date
Name
Owned For
Owner Type
Purchase Details
Closed on
May 18, 2005
Sold by
Hud and Armstrong Carole
Bought by
Hernandez Jose A
Current Estimated Value
Home Financials for this Owner
Home Financials are based on the most recent Mortgage that was taken out on this home.
Original Mortgage
$40,480
Interest Rate
5.59%
Mortgage Type
Fannie Mae Freddie Mac
Purchase Details
Closed on
Jan 20, 2005
Sold by
Mortgage Electronic Registration Systems
Bought by
Hud
Purchase Details
Closed on
Dec 14, 2004
Sold by
Calpino W M and Calpino Kelly J
Bought by
Mortgage Electronic Registration Systems
Create a Home Valuation Report for This Property
The Home Valuation Report is an in-depth analysis detailing your home's value as well as a comparison with similar homes in the area
Home Values in the Area
Average Home Value in this Area
Purchase History
| Date | Buyer | Sale Price | Title Company |
|---|---|---|---|
| Hernandez Jose A | $50,600 | -- | |
| Hud | -- | -- | |
| Mortgage Electronic Registration Systems | $20,000 | -- |
Source: Public Records
Mortgage History
| Date | Status | Borrower | Loan Amount |
|---|---|---|---|
| Previous Owner | Hernandez Jose A | $40,480 |
Source: Public Records
Tax History Compared to Growth
Tax History
| Year | Tax Paid | Tax Assessment Tax Assessment Total Assessment is a certain percentage of the fair market value that is determined by local assessors to be the total taxable value of land and additions on the property. | Land | Improvement |
|---|---|---|---|---|
| 2025 | $1,392 | $51,300 | $11,100 | $40,200 |
| 2024 | $2,278 | $51,300 | $11,100 | $40,200 |
| 2023 | $2,243 | $51,300 | $11,100 | $40,200 |
| 2022 | $2,243 | $51,300 | $11,100 | $40,200 |
| 2021 | $2,243 | $51,300 | $11,100 | $40,200 |
| 2020 | $2,220 | $51,300 | $11,100 | $40,200 |
| 2019 | $1,268 | $51,300 | $11,100 | $40,200 |
| 2018 | $2,220 | $51,300 | $11,100 | $40,200 |
| 2017 | $2,205 | $51,300 | $11,100 | $40,200 |
| 2016 | $1,260 | $51,300 | $11,100 | $40,200 |
| 2015 | $1,260 | $51,300 | $11,100 | $40,200 |
| 2014 | $1,159 | $51,300 | $11,100 | $40,200 |
Source: Public Records
Map
Nearby Homes