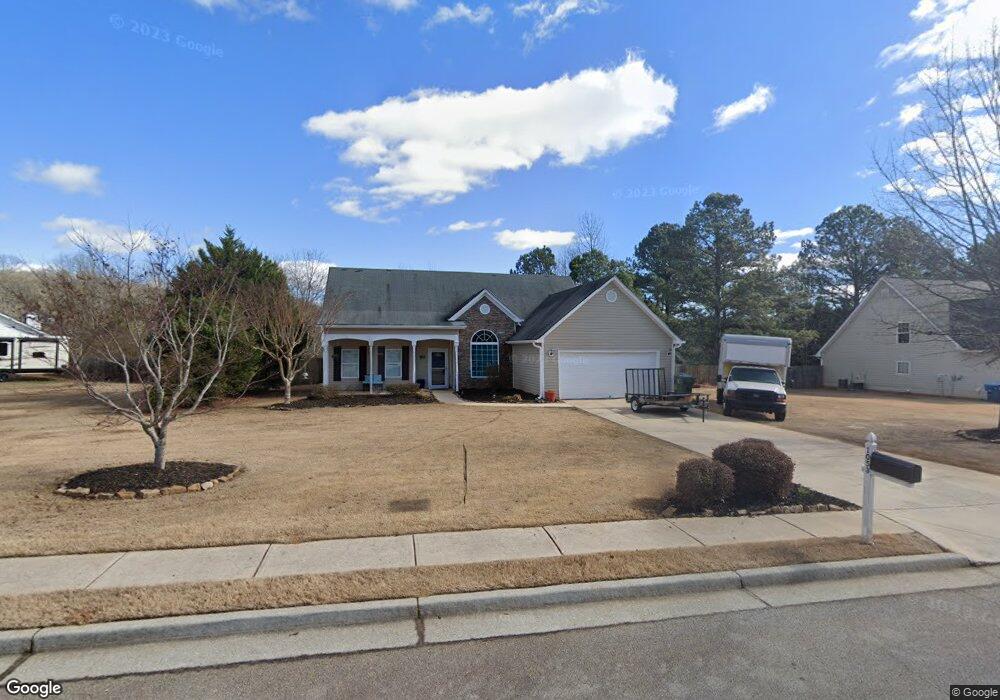
1053 Orchard Cir Unit 30 Monroe, GA 30656
Estimated Value: $314,000 - $362,000
3
Beds
2
Baths
1,613
Sq Ft
$211/Sq Ft
Est. Value
About This Home
This home is located at 1053 Orchard Cir Unit 30, Monroe, GA 30656 and is currently estimated at $339,919, approximately $210 per square foot. 1053 Orchard Cir Unit 30 is a home located in Walton County with nearby schools including Walker Park Elementary School, Carver Middle School, and Monroe Area High School.
Ownership History
Date
Name
Owned For
Owner Type
Purchase Details
Closed on
Feb 10, 2023
Sold by
Macko Janet
Bought by
Cannon Shane Edward
Current Estimated Value
Home Financials for this Owner
Home Financials are based on the most recent Mortgage that was taken out on this home.
Original Mortgage
$309,294
Outstanding Balance
$298,280
Interest Rate
5.62%
Mortgage Type
FHA
Estimated Equity
$41,639
Purchase Details
Closed on
Dec 24, 2015
Sold by
Alexander Ashley
Bought by
Macko Janet
Home Financials for this Owner
Home Financials are based on the most recent Mortgage that was taken out on this home.
Original Mortgage
$120,624
Interest Rate
3.75%
Mortgage Type
FHA
Purchase Details
Closed on
Sep 30, 2005
Sold by
Harrington Hms Inc
Bought by
Alexander Ashley M
Home Financials for this Owner
Home Financials are based on the most recent Mortgage that was taken out on this home.
Original Mortgage
$134,850
Interest Rate
5.66%
Mortgage Type
VA
Create a Home Valuation Report for This Property
The Home Valuation Report is an in-depth analysis detailing your home's value as well as a comparison with similar homes in the area
Home Values in the Area
Average Home Value in this Area
Purchase History
| Date | Buyer | Sale Price | Title Company |
|---|---|---|---|
| Cannon Shane Edward | $315,000 | -- | |
| Macko Janet | $129,500 | -- | |
| Alexander Ashley M | $137,400 | -- |
Source: Public Records
Mortgage History
| Date | Status | Borrower | Loan Amount |
|---|---|---|---|
| Open | Cannon Shane Edward | $309,294 | |
| Previous Owner | Macko Janet | $120,624 | |
| Previous Owner | Alexander Ashley M | $134,850 |
Source: Public Records
Tax History Compared to Growth
Tax History
| Year | Tax Paid | Tax Assessment Tax Assessment Total Assessment is a certain percentage of the fair market value that is determined by local assessors to be the total taxable value of land and additions on the property. | Land | Improvement |
|---|---|---|---|---|
| 2024 | $3,774 | $126,920 | $20,800 | $106,120 |
| 2023 | $2,713 | $116,960 | $19,200 | $97,760 |
| 2022 | $2,461 | $95,040 | $16,000 | $79,040 |
| 2021 | $1,963 | $66,800 | $12,000 | $54,800 |
| 2020 | $1,942 | $63,520 | $12,000 | $51,520 |
| 2019 | $1,869 | $58,480 | $12,000 | $46,480 |
| 2018 | $1,824 | $58,480 | $12,000 | $46,480 |
| 2017 | $2,015 | $58,480 | $12,000 | $46,480 |
| 2016 | $1,771 | $50,680 | $12,000 | $38,680 |
| 2015 | $1,597 | $47,320 | $12,000 | $35,320 |
| 2014 | $1,193 | $34,800 | $8,000 | $26,800 |
Source: Public Records
Map
Nearby Homes
- 1040 Orchard Cir
- 1064 Emmas Path
- 2069 Highway 11 NW
- 1602 Annas Way
- 809 Parker Ct NW
- 0 Nicholsville Rd Unit 10390907
- 1482 Waverly Way
- 2133 Stonegate Way
- 2316 Pebble Trail
- 2321 Pebble Trail
- 1409 Hwy 11 N
- 2790 Fannie Thompson Rd NW
- (GA)The Cooper | Side Entry Plan at Stonegate
- Riley A.2 3 Side Entry Plan at Stonegate
- (GA)The Kirkland | Side Entry Plan at Stonegate
- (GA)Woodmont A.1 3 Side Entry Plan at Stonegate
- (GA)The Woodmont | Side Entry Plan at Stonegate
- The Riley | Side Entry Plan at Stonegate
- 3055 Spring Hill Dr
- 2305 Margaux Ct
- 1053 Orchard Cir
- 1051 Orchard Cir
- 1057 Orchard Cir
- 1007 Orchard Cir
- 1009 Orchard Cir
- 1049 Orchard Cir
- 1056 Orchard Cir
- 1054 Orchard Cir
- 1005 Orchard Cir
- 1052 Orchard Cir
- 1011 Orchard Cir
- 1059 Orchard Cir
- 1060 Orchard Cir
- 1058 Orchard Cir
- 1050 Orchard Cir
- 1047 Orchard Cir
- 1013 Orchard Cir
- 1048 Orchard Cir
- 1008 Orchard Cir
- 1010 Orchard Cir