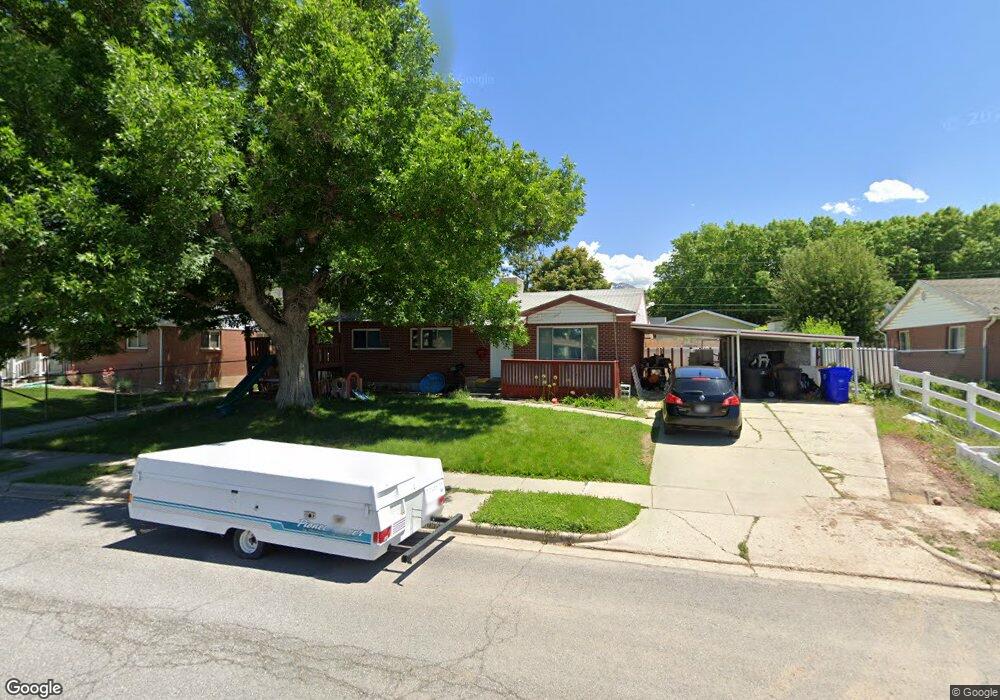
1053 S 400 W Bountiful, UT 84010
Estimated Value: $550,055 - $703,000
5
Beds
3
Baths
3,066
Sq Ft
$199/Sq Ft
Est. Value
About This Home
This home is located at 1053 S 400 W, Bountiful, UT 84010 and is currently estimated at $609,514, approximately $198 per square foot. 1053 S 400 W is a home located in Davis County with nearby schools including Bountiful Elementary School, Millcreek Junior High School, and Bountiful High School.
Ownership History
Date
Name
Owned For
Owner Type
Purchase Details
Closed on
Jan 14, 2020
Sold by
Boyce David J
Bought by
Buck Zackary
Current Estimated Value
Home Financials for this Owner
Home Financials are based on the most recent Mortgage that was taken out on this home.
Original Mortgage
$362,316
Outstanding Balance
$319,434
Interest Rate
3.6%
Mortgage Type
FHA
Estimated Equity
$290,080
Purchase Details
Closed on
Jun 11, 2019
Sold by
Sander John
Bought by
Boyce David J
Home Financials for this Owner
Home Financials are based on the most recent Mortgage that was taken out on this home.
Original Mortgage
$199,000
Interest Rate
4.1%
Mortgage Type
Commercial
Purchase Details
Closed on
May 21, 2003
Sold by
Jones Joan S
Bought by
Jones Joan and Jones Dana
Home Financials for this Owner
Home Financials are based on the most recent Mortgage that was taken out on this home.
Original Mortgage
$50,000
Interest Rate
5.75%
Mortgage Type
Purchase Money Mortgage
Create a Home Valuation Report for This Property
The Home Valuation Report is an in-depth analysis detailing your home's value as well as a comparison with similar homes in the area
Purchase History
| Date | Buyer | Sale Price | Title Company |
|---|---|---|---|
| Buck Zackary | -- | Advanced Title Ins | |
| Boyce David J | -- | Title Guarantee | |
| Jones Joan | -- | Preferred Title & Escrow |
Source: Public Records
Mortgage History
| Date | Status | Borrower | Loan Amount |
|---|---|---|---|
| Open | Buck Zackary | $362,316 | |
| Previous Owner | Boyce David J | $199,000 | |
| Previous Owner | Jones Joan | $50,000 |
Source: Public Records
Tax History
| Year | Tax Paid | Tax Assessment Tax Assessment Total Assessment is a certain percentage of the fair market value that is determined by local assessors to be the total taxable value of land and additions on the property. | Land | Improvement |
|---|---|---|---|---|
| 2025 | $3,582 | $295,900 | $122,184 | $173,716 |
| 2024 | $3,158 | $285,999 | $106,323 | $179,676 |
| 2023 | $2,865 | $496,000 | $198,290 | $297,710 |
| 2022 | $3,041 | $289,301 | $109,005 | $180,296 |
| 2021 | $2,764 | $402,000 | $142,542 | $259,458 |
| 2020 | $2,431 | $355,000 | $122,650 | $232,350 |
| 2019 | $2,347 | $334,000 | $136,245 | $197,755 |
| 2018 | $2,222 | $295,089 | $133,676 | $161,413 |
| 2016 | $1,566 | $112,695 | $53,886 | $58,809 |
| 2015 | $1,517 | $107,030 | $53,886 | $53,144 |
| 2014 | $1,560 | $113,645 | $53,886 | $59,759 |
| 2013 | -- | $128,145 | $36,190 | $91,955 |
Source: Public Records
Map
Nearby Homes
Your Personal Tour Guide
Ask me questions while you tour the home.