Estimated Value: $230,456 - $249,000
2
Beds
2
Baths
1,264
Sq Ft
$188/Sq Ft
Est. Value
About This Home
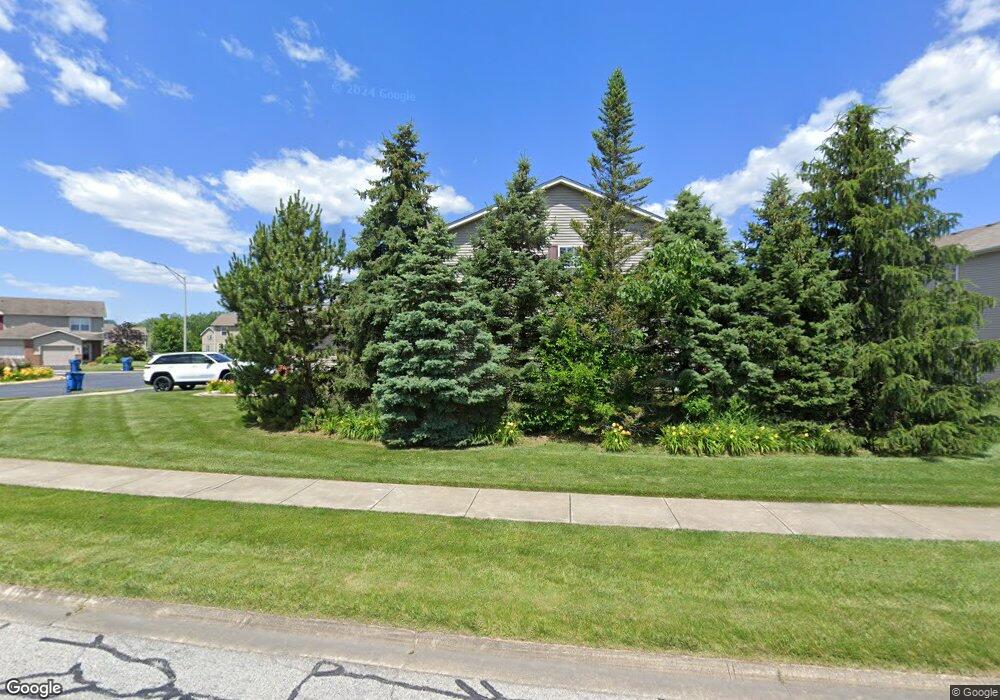
This home is located at 1053 Summertime Ct Unit 153-3, Dyer, IN 46311 and is currently estimated at $238,114, approximately $188 per square foot. 1053 Summertime Ct Unit 153-3 is a home located in Lake County with nearby schools including Kahler Middle School, Protsman Elementary School, and Lake Central High School.
Ownership History
Date
Name
Owned For
Owner Type
Purchase Details
Closed on
Sep 12, 2018
Sold by
Alvarez Patricia and Mota Patricia
Bought by
Kwiatt Jennifer
Current Estimated Value
Home Financials for this Owner
Home Financials are based on the most recent Mortgage that was taken out on this home.
Original Mortgage
$153,255
Outstanding Balance
$133,372
Interest Rate
4.5%
Mortgage Type
New Conventional
Estimated Equity
$104,742
Purchase Details
Closed on
Jun 20, 2008
Sold by
Cowins Anthony
Bought by
Mota Patricia
Home Financials for this Owner
Home Financials are based on the most recent Mortgage that was taken out on this home.
Original Mortgage
$100,000
Interest Rate
6.36%
Mortgage Type
Unknown
Purchase Details
Closed on
Mar 29, 2005
Sold by
Rockwell Development Llc
Bought by
Cowins Anthony
Home Financials for this Owner
Home Financials are based on the most recent Mortgage that was taken out on this home.
Original Mortgage
$139,969
Interest Rate
7.5%
Mortgage Type
Fannie Mae Freddie Mac
Create a Home Valuation Report for This Property
The Home Valuation Report is an in-depth analysis detailing your home's value as well as a comparison with similar homes in the area
Home Values in the Area
Average Home Value in this Area
Purchase History
| Date | Buyer | Sale Price | Title Company |
|---|---|---|---|
| Kwiatt Jennifer | -- | Chicago Title Ins Co | |
| Mota Patricia | -- | Community Title Company | |
| Cowins Anthony | -- | Ticor Title |
Source: Public Records
Mortgage History
| Date | Status | Borrower | Loan Amount |
|---|---|---|---|
| Open | Kwiatt Jennifer | $153,255 | |
| Previous Owner | Mota Patricia | $100,000 | |
| Previous Owner | Cowins Anthony | $139,969 |
Source: Public Records
Tax History Compared to Growth
Tax History
| Year | Tax Paid | Tax Assessment Tax Assessment Total Assessment is a certain percentage of the fair market value that is determined by local assessors to be the total taxable value of land and additions on the property. | Land | Improvement |
|---|---|---|---|---|
| 2024 | $4,679 | $191,300 | $35,000 | $156,300 |
| 2023 | $1,595 | $184,000 | $35,000 | $149,000 |
| 2022 | $1,595 | $157,400 | $35,000 | $122,400 |
| 2021 | $1,740 | $169,800 | $35,000 | $134,800 |
| 2020 | $1,604 | $157,000 | $35,000 | $122,000 |
| 2019 | $1,540 | $147,300 | $35,000 | $112,300 |
| 2018 | $1,414 | $142,500 | $35,000 | $107,500 |
| 2017 | $1,284 | $140,100 | $35,000 | $105,100 |
| 2016 | $1,163 | $130,100 | $35,000 | $95,100 |
| 2014 | $1,082 | $130,500 | $35,000 | $95,500 |
| 2013 | $1,084 | $129,400 | $35,000 | $94,400 |
Source: Public Records
Map
Nearby Homes
- 1039 Summertime Ct
- 1769 Autumn Ct
- 1065 Flagstone Dr
- 1030 Rockwell Ln
- 1211 Joliet St
- T-1415 Adler Plan at Parkside
- T-1647 Wren Plan at Parkside
- 2316 Boulder Rd
- 2308 Flint Ct
- 1451 Joliet St
- 2265 Sandcastle Dr
- 2264 Sandcastle Dr
- 1437 Madison Ave
- 2325 Hickory Dr
- 2428 Rolling Hill Dr
- 511 Devon Dr
- 1011 Arrowhead Dr
- 2405 Kings Ct
- 1932 Church St
- 1594 Joliet St
- 1053 Summertime Ct
- 1055 Summertime Ct
- 1051 Summertime Ct
- 1051 Summertime Ct Unit 153-2
- 1049 Summertime Ct
- 1049 Summertime Ct Unit 153-1
- 1764 Springtime Ct
- 1762 Springtime Ct
- 1762 Springtime Ct Unit 152-3
- 1766 Springtime Ct
- 1766 Springtime Ct Unit 152-1
- 1760 Springtime Ct
- 1043 Summertime Ct
- 1043 Summertime Ct Unit 154-4
- 1754 Springtime Ct
- 1041 Summertime Ct
- 1041 Summertime Ct Unit 154-3
- 1752 Springtime Ct
- 1039 Summertime Ct Unit 154-2
- 1750 Springtime Ct