10530 Lake Park Dr Dripping Springs, TX 78620
Hamilton Pool NeighborhoodEstimated Value: $478,085 - $529,000
--
Bed
2
Baths
1,838
Sq Ft
$279/Sq Ft
Est. Value
About This Home
This home is located at 10530 Lake Park Dr, Dripping Springs, TX 78620 and is currently estimated at $512,271, approximately $278 per square foot. 10530 Lake Park Dr is a home located in Travis County with nearby schools including Bee Cave Elementary School, Bee Cave Middle School, and Lake Travis High School.
Ownership History
Date
Name
Owned For
Owner Type
Purchase Details
Closed on
May 24, 2021
Sold by
Rush Sandra R
Bought by
Senduk Glenda Elaine and Reyes Ortiz Hugo
Current Estimated Value
Home Financials for this Owner
Home Financials are based on the most recent Mortgage that was taken out on this home.
Original Mortgage
$360,000
Outstanding Balance
$325,740
Interest Rate
3%
Mortgage Type
Purchase Money Mortgage
Estimated Equity
$186,531
Purchase Details
Closed on
Apr 7, 2010
Sold by
Demerjian Robert A and Demerjian Robert Andrew
Bought by
Rush Sandra R
Home Financials for this Owner
Home Financials are based on the most recent Mortgage that was taken out on this home.
Original Mortgage
$135,000
Interest Rate
4.91%
Mortgage Type
Seller Take Back
Purchase Details
Closed on
Jan 9, 2004
Sold by
Park Hills Baptist Church Inc
Bought by
Demerjian Robert A and Demerjian Terrace
Create a Home Valuation Report for This Property
The Home Valuation Report is an in-depth analysis detailing your home's value as well as a comparison with similar homes in the area
Home Values in the Area
Average Home Value in this Area
Purchase History
| Date | Buyer | Sale Price | Title Company |
|---|---|---|---|
| Senduk Glenda Elaine | -- | Independence Title Company | |
| Rush Sandra R | -- | Independence Title Co | |
| Demerjian Robert A | -- | -- |
Source: Public Records
Mortgage History
| Date | Status | Borrower | Loan Amount |
|---|---|---|---|
| Open | Senduk Glenda Elaine | $360,000 | |
| Previous Owner | Rush Sandra R | $135,000 |
Source: Public Records
Tax History Compared to Growth
Tax History
| Year | Tax Paid | Tax Assessment Tax Assessment Total Assessment is a certain percentage of the fair market value that is determined by local assessors to be the total taxable value of land and additions on the property. | Land | Improvement |
|---|---|---|---|---|
| 2025 | $5,946 | $474,084 | $111,543 | $362,541 |
| 2023 | $5,729 | $537,104 | $106,250 | $430,854 |
| 2022 | $10,320 | $601,474 | $106,250 | $495,224 |
| 2021 | $6,936 | $385,508 | $87,500 | $298,008 |
| 2020 | $6,763 | $353,653 | $25,000 | $328,653 |
| 2018 | $6,310 | $318,055 | $25,000 | $299,461 |
| 2017 | $5,788 | $289,141 | $25,000 | $293,364 |
| 2016 | $5,262 | $262,855 | $25,000 | $255,679 |
| 2015 | $3,512 | $238,959 | $23,625 | $215,334 |
| 2014 | $3,512 | $220,042 | $0 | $0 |
Source: Public Records
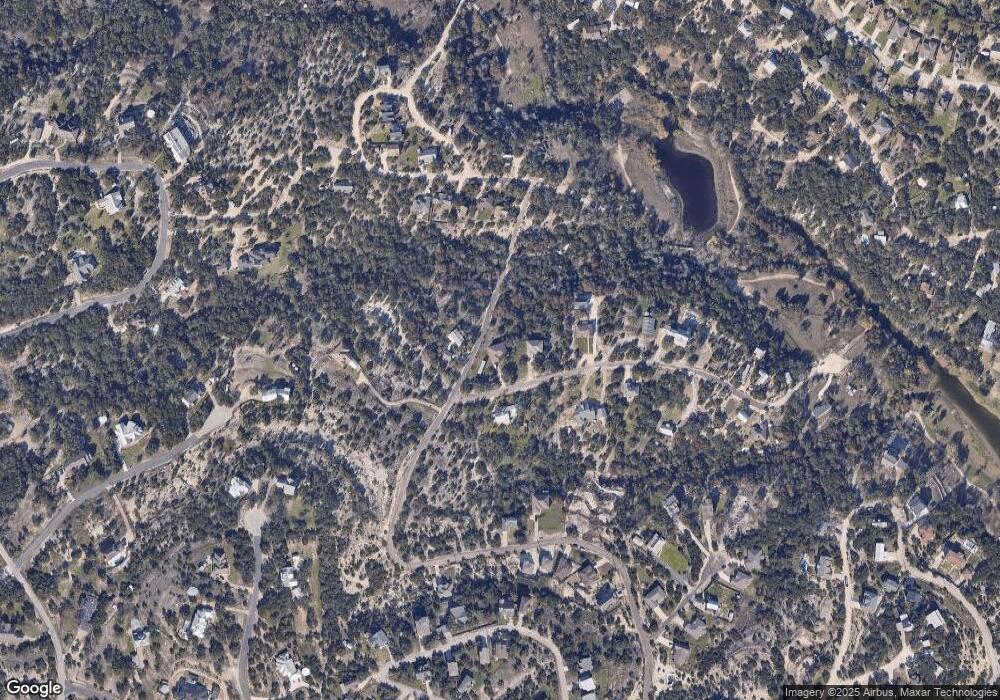
Map
Nearby Homes
- 10627 Lake Park Dr
- 10624 Lake Park Dr
- 10511 Lake Park Dr
- 10722 Lake Park Dr
- 17517 Panorama Dr
- 17837 Panorama Dr
- 17912 Turkey Trot Trail
- 17811 Mason Dixon Cir
- 17601 Lake Shore Dr
- 17503 Lake Shore Dr
- 17503 Panorama Dr
- 17610 Village Dr
- 10978 W Cave Blvd
- 10129 Longhorn Skyway
- 10806 Glenview Cir
- 0 Westward Look
- 10115 Longhorn Skyway
- 10113 Longhorn Skyway
- 17110 Oak Cliff Cir
- 17201 Oak Cliff Cir
- 10526 Lake Park Dr
- 10504 Ridgeview Cir
- 10506 Ridgeview Cir
- 10500 Ridgeview Cir
- 10525 Lake Park Dr
- 10522 Lake Park Dr
- 10521 Lake Park Dr
- 10605 Lake Park Dr
- 0 Mason Dixon Cir
- 10403 Ridgeview Cir
- 10520 Lake Park Dr
- 10402 & 10404 Ridgeview Cir
- 10402 & 10404 Ridgeview Cir
- 10402 Ridgeview Cir
- 10600 Lake Park Dr
- 10517 Lake Park Dr
- 17707 Westlake Dr
- 10602 Lake Park Dr
- 17701 Westlake Dr
- 17703 Westlake Dr