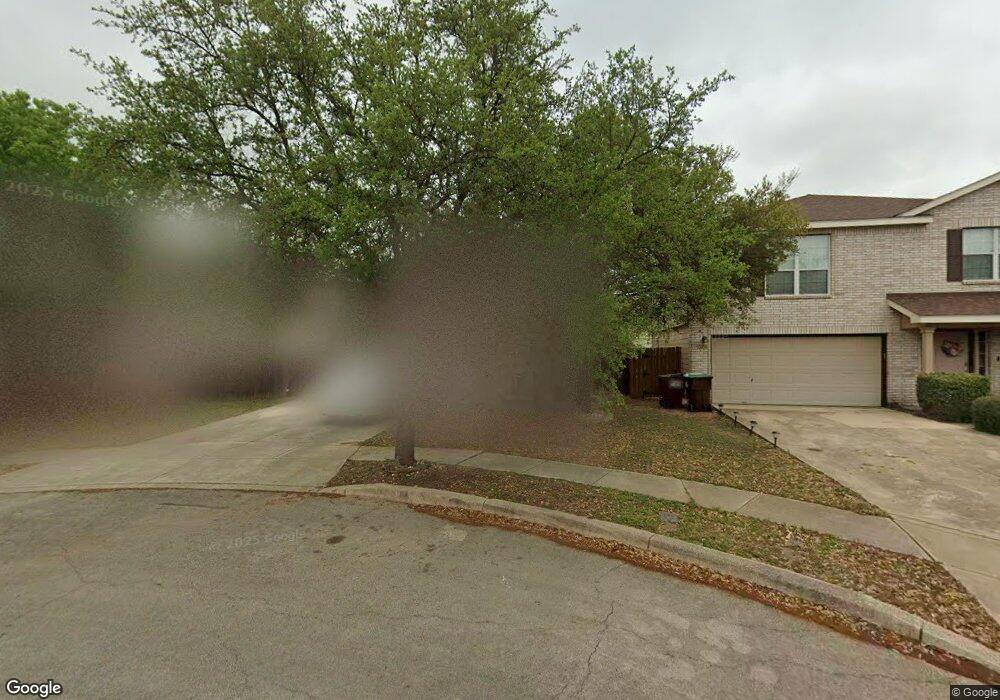
10531 Marigold Bay San Antonio, TX 78254
Estimated Value: $248,172 - $279,000
3
Beds
2
Baths
1,596
Sq Ft
$167/Sq Ft
Est. Value
About This Home
This home is located at 10531 Marigold Bay, San Antonio, TX 78254 and is currently estimated at $265,793, approximately $166 per square foot. 10531 Marigold Bay is a home located in Bexar County with nearby schools including Krueger Elementary School, Jefferson Middle School, and School of Science and Technology Hill Country.
Ownership History
Date
Name
Owned For
Owner Type
Purchase Details
Closed on
Feb 17, 2016
Sold by
Benjamin Orsirk Gerell
Bought by
Benjamin Debra L
Current Estimated Value
Home Financials for this Owner
Home Financials are based on the most recent Mortgage that was taken out on this home.
Original Mortgage
$40,990
Outstanding Balance
$17,554
Interest Rate
3.81%
Mortgage Type
Stand Alone Second
Estimated Equity
$248,239
Purchase Details
Closed on
Nov 26, 2003
Sold by
Continental Homes Of Texas Lp
Bought by
Benjamin Orsirk Gerell
Home Financials for this Owner
Home Financials are based on the most recent Mortgage that was taken out on this home.
Original Mortgage
$112,610
Outstanding Balance
$52,655
Interest Rate
6.01%
Mortgage Type
FHA
Estimated Equity
$213,138
Create a Home Valuation Report for This Property
The Home Valuation Report is an in-depth analysis detailing your home's value as well as a comparison with similar homes in the area
Home Values in the Area
Average Home Value in this Area
Purchase History
| Date | Buyer | Sale Price | Title Company |
|---|---|---|---|
| Benjamin Debra L | -- | Title365 | |
| Benjamin Orsirk Gerell | -- | -- |
Source: Public Records
Mortgage History
| Date | Status | Borrower | Loan Amount |
|---|---|---|---|
| Open | Benjamin Debra L | $40,990 | |
| Open | Benjamin Orsirk Gerell | $112,610 |
Source: Public Records
Tax History Compared to Growth
Tax History
| Year | Tax Paid | Tax Assessment Tax Assessment Total Assessment is a certain percentage of the fair market value that is determined by local assessors to be the total taxable value of land and additions on the property. | Land | Improvement |
|---|---|---|---|---|
| 2025 | $3,362 | $252,800 | $42,780 | $210,020 |
| 2024 | $3,362 | $252,065 | $42,780 | $210,020 |
| 2023 | $3,362 | $229,150 | $42,780 | $211,130 |
| 2022 | $4,231 | $208,318 | $35,670 | $205,450 |
| 2021 | $3,987 | $189,380 | $32,440 | $156,940 |
| 2020 | $3,908 | $181,700 | $32,400 | $149,300 |
| 2019 | $3,746 | $168,680 | $31,370 | $137,310 |
| 2018 | $3,526 | $158,670 | $31,370 | $127,300 |
| 2017 | $3,430 | $154,000 | $31,370 | $122,630 |
| 2016 | $3,333 | $149,640 | $31,370 | $118,270 |
| 2015 | $2,801 | $142,520 | $31,370 | $111,150 |
| 2014 | $2,801 | $134,330 | $0 | $0 |
Source: Public Records
Map
Nearby Homes
- 9607 Country Shadow
- 10511 Marengo Ln
- 9427 Velvet Spring
- 10627 Arabian Sands
- 9807 Sandlet Trail
- 9950 Sandlet Trail
- 9951 Sandlet Trail
- 10322 Filly Valley
- 10707 Arabian Sands
- 9214 Herman Hollow
- 9726 Palomino Oaks
- 10523 Timber Country
- 9510 Caspian Forest
- 9050 Herman Hollow
- 10814 Mustang Oak Dr
- 10814 Shetland Hills
- 10703 Spirit Roam
- 9407 Pegasus Run Rd
- 8819 Liberty Sky Dr
- 10706 Pharaoh Run
- 10527 Marigold Bay
- 10535 Marigold Bay
- 10523 Marigold Bay
- 10430 Stallion Bay
- 10434 Stallion Bay
- 10426 Stallion Bay
- 10519 Marigold Bay
- 10422 Stallion Bay
- 10438 Stallion Bay
- 10418 Stallion Bay
- 10515 Marigold Bay
- 10534 Marigold Bay
- 10526 Marigold Bay
- 10522 Marigold Bay
- 10414 Stallion Bay
- 10518 Marigold Bay
- 10511 Marigold Bay
- 10410 Stallion Bay
- 10514 Marigold Bay
- 10507 Marigold Bay