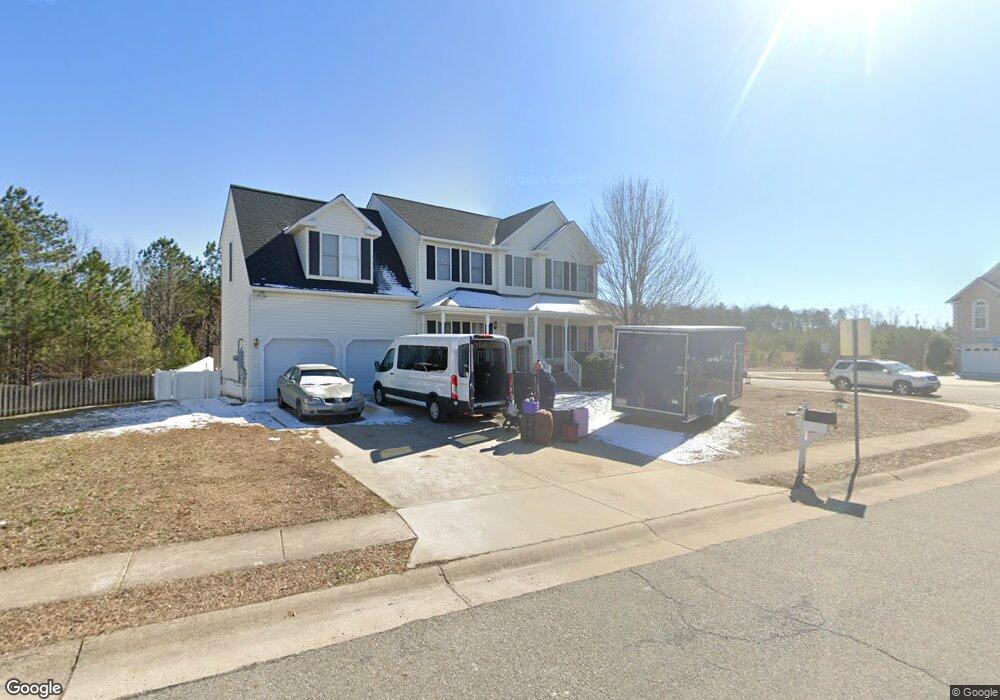
10533 Whirlaway Ln Ruther Glen, VA 22546
Estimated Value: $476,000 - $579,000
5
Beds
4
Baths
3,952
Sq Ft
$135/Sq Ft
Est. Value
About This Home
This home is located at 10533 Whirlaway Ln, Ruther Glen, VA 22546 and is currently estimated at $532,259, approximately $134 per square foot. 10533 Whirlaway Ln is a home located in Caroline County with nearby schools including Caroline Middle School and Caroline High School.
Ownership History
Date
Name
Owned For
Owner Type
Purchase Details
Closed on
Sep 22, 2010
Sold by
Nostrame Catherine
Bought by
Allen Benjamin L and Allen Rosina A
Current Estimated Value
Home Financials for this Owner
Home Financials are based on the most recent Mortgage that was taken out on this home.
Original Mortgage
$259,900
Outstanding Balance
$171,968
Interest Rate
4.48%
Mortgage Type
VA
Estimated Equity
$360,291
Purchase Details
Closed on
May 27, 2010
Sold by
Walters Patricia A and Carroll Billy
Bought by
Nostrame Catherine
Purchase Details
Closed on
Nov 3, 2003
Sold by
Construct T and Construct J C
Bought by
Walters Patricia and Carroll,Billy
Home Financials for this Owner
Home Financials are based on the most recent Mortgage that was taken out on this home.
Original Mortgage
$200,000
Interest Rate
6.05%
Mortgage Type
New Conventional
Create a Home Valuation Report for This Property
The Home Valuation Report is an in-depth analysis detailing your home's value as well as a comparison with similar homes in the area
Home Values in the Area
Average Home Value in this Area
Purchase History
| Date | Buyer | Sale Price | Title Company |
|---|---|---|---|
| Allen Benjamin L | $259,900 | Ekko Title Lc | |
| Nostrame Catherine | $179,201 | Carteret Title Llc | |
| Walters Patricia | $260,046 | -- |
Source: Public Records
Mortgage History
| Date | Status | Borrower | Loan Amount |
|---|---|---|---|
| Open | Allen Benjamin L | $259,900 | |
| Previous Owner | Walters Patricia | $200,000 |
Source: Public Records
Tax History Compared to Growth
Tax History
| Year | Tax Paid | Tax Assessment Tax Assessment Total Assessment is a certain percentage of the fair market value that is determined by local assessors to be the total taxable value of land and additions on the property. | Land | Improvement |
|---|---|---|---|---|
| 2025 | $392,292 | $509,470 | $67,000 | $442,470 |
| 2024 | $2,812 | $365,200 | $57,000 | $308,200 |
| 2023 | $2,812 | $365,200 | $57,000 | $308,200 |
| 2022 | $2,812 | $365,200 | $57,000 | $308,200 |
| 2021 | $2,812 | $365,200 | $57,000 | $308,200 |
| 2020 | $2,219 | $267,400 | $51,000 | $216,400 |
| 2019 | $2,219 | $267,400 | $51,000 | $216,400 |
| 2018 | $2,219 | $267,400 | $51,000 | $216,400 |
| 2017 | $2,219 | $267,400 | $51,000 | $216,400 |
| 2016 | $2,193 | $267,400 | $51,000 | $216,400 |
| 2015 | $1,889 | $266,800 | $51,000 | $215,800 |
| 2014 | $1,889 | $266,800 | $51,000 | $215,800 |
Source: Public Records
Map
Nearby Homes
- 10629 Gallant Fox Way
- 23214 Westwood Ct
- 23212 Westwood Ct
- 23055 Sir Barton Ct Unit 5B
- 23036 Sir Barton Ct
- 24004 Ruther Glen Rd
- 7103 Resolution Way Ct
- 0 Doggetts Fork Rd Unit 2514083
- 00 Lewis Moore Rd
- 22175 Cool Water Dr
- 24459 Us Route 1 Hwy
- 24072 Telegraph Rd
- 22009 Cool Water Dr
- 23124 Telegraph Rd
- 25294 Peaceful Valley Rd
- None U S Route 1
- 0 Us Route 1
- 8158 Tate Rd
- 26022 Zion Rd
- 26081 Ruther Glen Rd
- 10523 Whirlaway Ln
- 23309 Johnstown Ln
- 23322 Johnstown Ln
- 10519 Whirlaway Ln
- 23310 Johnstown Ln
- 10510 Whirlaway Ln
- 23299 Johnstown Ln
- 23302 Johnstown Ln
- 10513 Whirlaway Ln
- 10498 Whirlaway Ln
- 23293 Johnstown Ln
- 23294 Johnstown Ln
- 10507 Whirlaway Ln
- 10490 Whirlaway Ln
- 10501 Whirlaway Ln
- 23286 Johnstown Ln
- 0 Belmont Blvd
- 10493 Whirlaway Ln
- 10484 Whirlaway Ln
- 23277 Johnstown Ln