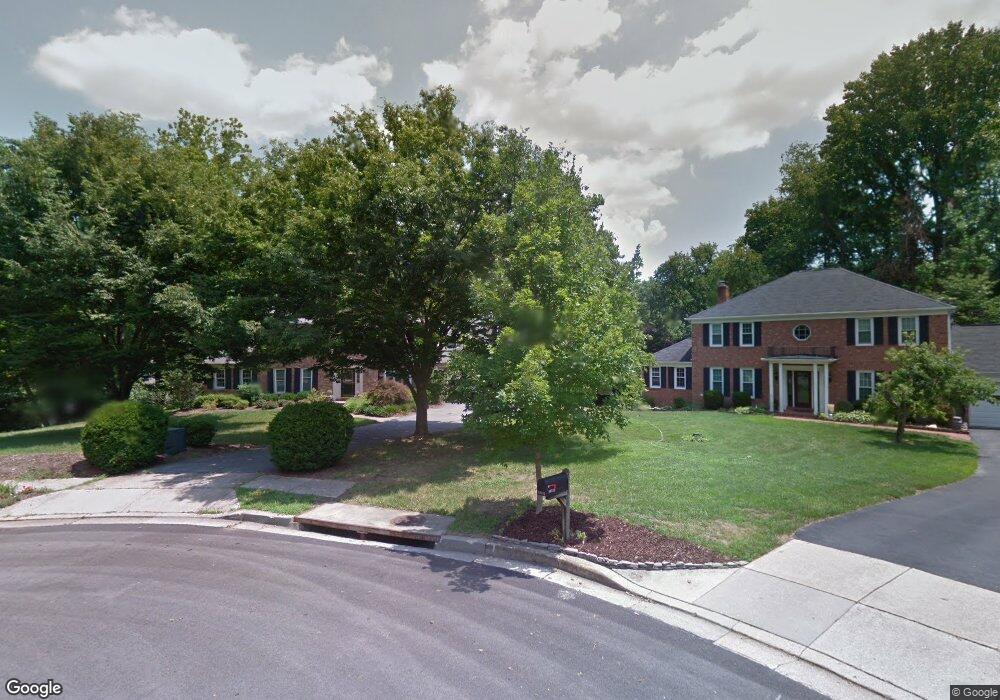
10536 Patuxent Ridge Way Laurel, MD 20723
Estimated Value: $841,050 - $956,000
--
Bed
3
Baths
3,206
Sq Ft
$273/Sq Ft
Est. Value
About This Home
This home is located at 10536 Patuxent Ridge Way, Laurel, MD 20723 and is currently estimated at $874,763, approximately $272 per square foot. 10536 Patuxent Ridge Way is a home located in Howard County with nearby schools including Hammond Elementary School, Hammond Middle School, and Atholton High School.
Ownership History
Date
Name
Owned For
Owner Type
Purchase Details
Closed on
Jun 25, 2024
Sold by
Powell Welsey Allen and Powell Tammy Phyllis
Bought by
Tammy And Wesley Powell Family Revocable Trus and Powell
Current Estimated Value
Purchase Details
Closed on
Nov 19, 1997
Sold by
Sartwell Bruce D
Bought by
Powell Wesley A and Powell Tammy
Purchase Details
Closed on
Jun 26, 1986
Sold by
King William L
Bought by
Sartwell Bruce D
Home Financials for this Owner
Home Financials are based on the most recent Mortgage that was taken out on this home.
Original Mortgage
$201,600
Interest Rate
10.61%
Purchase Details
Closed on
Sep 4, 1985
Sold by
Marker Co Inc F G
Bought by
King William L
Home Financials for this Owner
Home Financials are based on the most recent Mortgage that was taken out on this home.
Original Mortgage
$190,000
Interest Rate
12.11%
Create a Home Valuation Report for This Property
The Home Valuation Report is an in-depth analysis detailing your home's value as well as a comparison with similar homes in the area
Home Values in the Area
Average Home Value in this Area
Purchase History
| Date | Buyer | Sale Price | Title Company |
|---|---|---|---|
| Tammy And Wesley Powell Family Revocable Trus | -- | None Listed On Document | |
| Tammy And Wesley Powell Family Revocable Trus | -- | None Listed On Document | |
| Powell Wesley A | $275,000 | -- | |
| Sartwell Bruce D | $252,000 | -- | |
| King William L | $201,300 | -- |
Source: Public Records
Mortgage History
| Date | Status | Borrower | Loan Amount |
|---|---|---|---|
| Previous Owner | Sartwell Bruce D | $201,600 | |
| Previous Owner | King William L | $190,000 | |
| Closed | Powell Wesley A | -- |
Source: Public Records
Tax History Compared to Growth
Tax History
| Year | Tax Paid | Tax Assessment Tax Assessment Total Assessment is a certain percentage of the fair market value that is determined by local assessors to be the total taxable value of land and additions on the property. | Land | Improvement |
|---|---|---|---|---|
| 2025 | $9,658 | $653,400 | $194,500 | $458,900 |
| 2024 | $9,658 | $629,300 | $0 | $0 |
| 2023 | $9,151 | $605,200 | $0 | $0 |
| 2022 | $8,765 | $581,100 | $199,500 | $381,600 |
| 2021 | $8,450 | $570,133 | $0 | $0 |
| 2020 | $8,450 | $559,167 | $0 | $0 |
| 2019 | $8,292 | $548,200 | $182,400 | $365,800 |
| 2018 | $7,891 | $548,200 | $182,400 | $365,800 |
| 2017 | $7,863 | $548,200 | $0 | $0 |
| 2016 | -- | $555,600 | $0 | $0 |
| 2015 | -- | $532,567 | $0 | $0 |
| 2014 | -- | $509,533 | $0 | $0 |
Source: Public Records
Map
Nearby Homes
- 7641 Woodstream Way
- 10725 E Crestview Ln
- 7302 Isabella Rd
- 10774 W Crestview Ln
- 10633 Delfield Ct
- 7937 Hammond Pkwy
- 7505 Weather Worn Way Unit E
- 7505 Weather Worn Way Unit A
- 7573 Weather Worn Way Unit D
- 7688 Blackbriar Way
- 7700 Cultivator Rd
- 10665 Glen Hannah Dr
- 10687 Glen Hannah Dr
- 7840 Blackbriar Way
- 7459 Setting Sun Way
- 8208 Sandy Stream Rd
- 7858 Blackbriar Way
- 7862 Blackbriar Way
- 7866 Blackbriar Way
- 7870 Blackbriar Way
- 10532 Patuxent Ridge Way
- 10540 Patuxent Ridge Way
- 10548 Patuxent Ridge Way
- 10531 Hunters Way
- 10535 Hunters Way
- 10544 Patuxent Ridge Way
- 10528 Patuxent Ridge Way
- 10527 Hunters Way
- 10523 Hunters Way
- 10552 Patuxent Ridge Way
- 10553 Patuxent Ridge Way
- 10524 Patuxent Ridge Way
- 10515 Hunters Way
- 10511 Hunters Way
- 10519 Hunters Way
- 10557 Patuxent Ridge Way
- 10541 Patuxent Ridge Way
- 10507 Hunters Way
- 10532 Hunters Way
- 10549 Patuxent Ridge Way