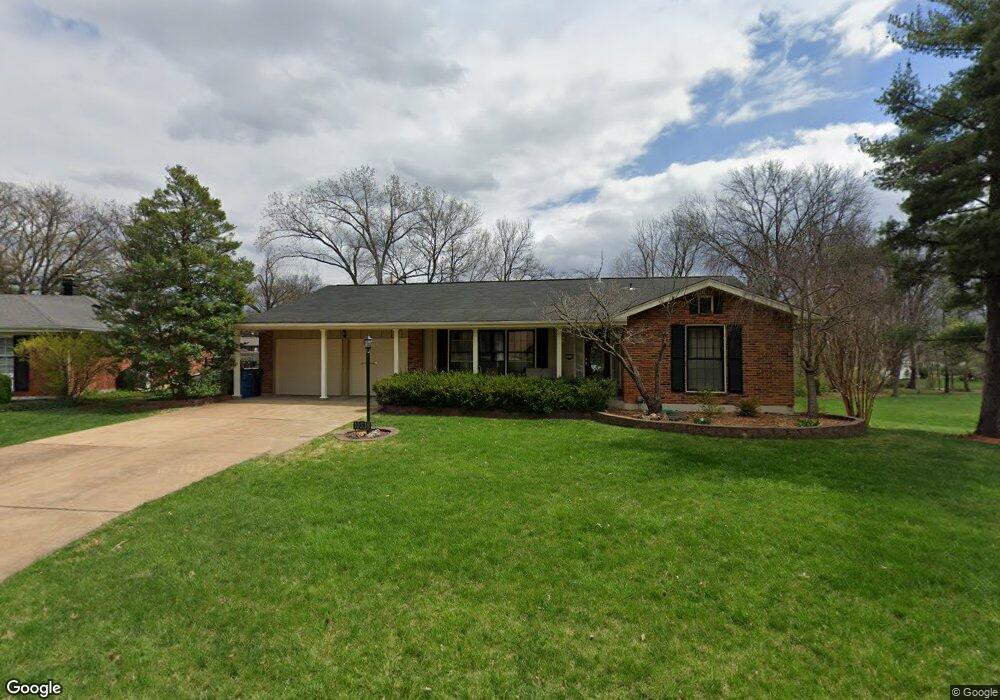
10538 Hackamore Ln Saint Louis, MO 63128
Sappington NeighborhoodEstimated Value: $450,000 - $477,000
3
Beds
2
Baths
1,815
Sq Ft
$258/Sq Ft
Est. Value
About This Home
This home is located at 10538 Hackamore Ln, Saint Louis, MO 63128 and is currently estimated at $467,400, approximately $257 per square foot. 10538 Hackamore Ln is a home located in St. Louis County with nearby schools including Concord Elementary School, Sperreng Middle School, and Lindbergh High School.
Ownership History
Date
Name
Owned For
Owner Type
Purchase Details
Closed on
Oct 29, 2013
Sold by
Thurman Erven William and Thurman Doris Lee
Bought by
Melenbrink Glenn A and Melenbrink Jean A
Current Estimated Value
Home Financials for this Owner
Home Financials are based on the most recent Mortgage that was taken out on this home.
Original Mortgage
$237,400
Outstanding Balance
$178,803
Interest Rate
4.56%
Mortgage Type
New Conventional
Estimated Equity
$288,597
Purchase Details
Closed on
Jun 12, 2012
Sold by
Thurman Erven W and Thurman Doris Lee
Bought by
Thurman Erven William and Thurman Doris Lee
Home Financials for this Owner
Home Financials are based on the most recent Mortgage that was taken out on this home.
Original Mortgage
$176,000
Interest Rate
3.8%
Mortgage Type
New Conventional
Purchase Details
Closed on
Jun 8, 2011
Sold by
Thurman Erven W and Thurman Doris Lee
Bought by
Thurman Erven William and Thurman Doris Lee
Create a Home Valuation Report for This Property
The Home Valuation Report is an in-depth analysis detailing your home's value as well as a comparison with similar homes in the area
Home Values in the Area
Average Home Value in this Area
Purchase History
| Date | Buyer | Sale Price | Title Company |
|---|---|---|---|
| Melenbrink Glenn A | $249,900 | Investors Title Co Clayton | |
| Thurman Erven William | -- | Title Partners Agency Llc | |
| Thurman Erven W | -- | Title Partners Agency Llc | |
| Thurman Erven William | -- | None Available |
Source: Public Records
Mortgage History
| Date | Status | Borrower | Loan Amount |
|---|---|---|---|
| Open | Melenbrink Glenn A | $237,400 | |
| Previous Owner | Thurman Erven W | $176,000 |
Source: Public Records
Tax History
| Year | Tax Paid | Tax Assessment Tax Assessment Total Assessment is a certain percentage of the fair market value that is determined by local assessors to be the total taxable value of land and additions on the property. | Land | Improvement |
|---|---|---|---|---|
| 2025 | $4,856 | $84,910 | $20,840 | $64,070 |
| 2024 | $4,856 | $74,750 | $19,100 | $55,650 |
| 2023 | $4,844 | $74,750 | $19,100 | $55,650 |
| 2022 | $4,410 | $65,280 | $20,840 | $44,440 |
| 2021 | $4,254 | $65,280 | $20,840 | $44,440 |
| 2020 | $4,193 | $62,090 | $18,640 | $43,450 |
| 2019 | $4,183 | $62,090 | $18,640 | $43,450 |
| 2018 | $3,977 | $53,680 | $10,260 | $43,420 |
| 2017 | $3,933 | $53,680 | $10,260 | $43,420 |
| 2016 | $3,513 | $45,490 | $11,190 | $34,300 |
Source: Public Records
Map
Nearby Homes
- 10587 Carroll Wood Way Unit 1
- 10819 Carroll Wood Way
- 10865 Carroll Wood Way Unit 1
- 10622 Carroll Wood Way
- 10682 Carroll Wood Way Unit 3
- 10140 Sakura Dr
- 10117 Sakura Dr Unit F
- 10070 Sakura Dr Unit 100070
- 10032 Sakura Dr
- 10041 Sakura Dr
- 10005 Sakura Dr Unit D
- 10008 Meadowfield Ln
- 11951 Tesson Ferry Rd Unit D
- 9738 Crestwick Dr
- 11542 Concord Village Ave
- 10915 Three Court Dr
- 10748 Leebur Dr
- 10652 Roanna Ln
- 9411 Gates Manor Ct
- 9404 Gates Manor Ct
- 10534 Hackamore Ln
- 10535 Hackamore Ln
- 10543 Hackamore Ln
- 10530 Hackamore Ln
- 10521 Twilight Dr
- 10529 Twilight Dr
- 10521 Hackamore Ln
- 10526 Hackamore Ln
- 10551 Hackamore Ln
- 10537 Twilight Dr
- 10569 Hackamore Ln
- 10515 Hackamore Ln
- 10513 Twilight Dr
- 4969 S Lindbergh Blvd
- 10522 Hackamore Ln
- 10600 Hackamore Ln
- 10545 Twilight Dr
- 10559 Hackamore Ln
- 10555 Hackamore Ln
- 10604 Hackamore Ln
Your Personal Tour Guide
Ask me questions while you tour the home.