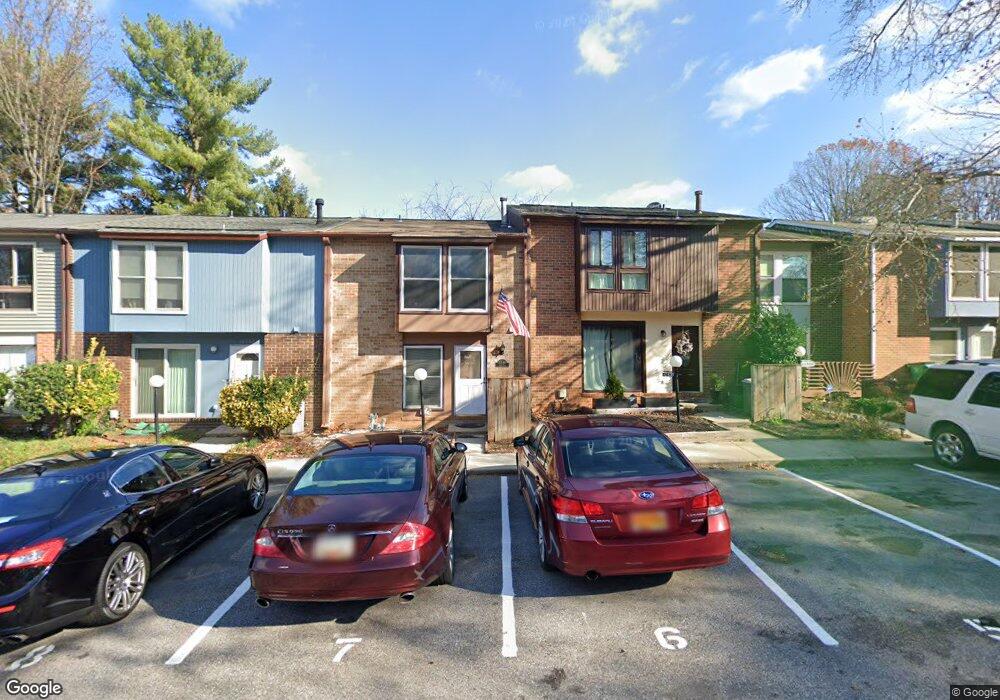
10538 Jason Ln Columbia, MD 21044
Wilde Lake NeighborhoodEstimated Value: $376,000 - $388,000
--
Bed
3
Baths
1,544
Sq Ft
$249/Sq Ft
Est. Value
About This Home
This home is located at 10538 Jason Ln, Columbia, MD 21044 and is currently estimated at $384,098, approximately $248 per square foot. 10538 Jason Ln is a home located in Howard County with nearby schools including Longfellow Elementary School, Harpers Choice Middle School, and Wilde Lake High.
Ownership History
Date
Name
Owned For
Owner Type
Purchase Details
Closed on
Apr 15, 2004
Sold by
Lanell Lorick Sonja
Bought by
Indru Jashnani and Indru Nima Jashnani
Current Estimated Value
Home Financials for this Owner
Home Financials are based on the most recent Mortgage that was taken out on this home.
Original Mortgage
$116,000
Interest Rate
5.67%
Mortgage Type
New Conventional
Purchase Details
Closed on
Apr 14, 2004
Sold by
Lorick Sonja Lanell
Bought by
Jashnani Indru and Jashnani Nima
Home Financials for this Owner
Home Financials are based on the most recent Mortgage that was taken out on this home.
Original Mortgage
$116,000
Interest Rate
5.67%
Mortgage Type
New Conventional
Purchase Details
Closed on
Aug 27, 1998
Sold by
Gamber Ann Marie
Bought by
Lorick Sonja Lanell
Purchase Details
Closed on
Nov 13, 1991
Sold by
Walker Richard E
Bought by
Gamber Ann Marie
Home Financials for this Owner
Home Financials are based on the most recent Mortgage that was taken out on this home.
Original Mortgage
$110,028
Interest Rate
8.76%
Create a Home Valuation Report for This Property
The Home Valuation Report is an in-depth analysis detailing your home's value as well as a comparison with similar homes in the area
Home Values in the Area
Average Home Value in this Area
Purchase History
| Date | Buyer | Sale Price | Title Company |
|---|---|---|---|
| Indru Jashnani | $145,000 | -- | |
| Jashnani Indru | $145,000 | -- | |
| Lorick Sonja Lanell | $107,000 | -- | |
| Gamber Ann Marie | $112,000 | -- |
Source: Public Records
Mortgage History
| Date | Status | Borrower | Loan Amount |
|---|---|---|---|
| Open | Jashnani Indru | $97,150 | |
| Previous Owner | Jashnani Nima | $116,000 | |
| Previous Owner | Gamber Ann Marie | $110,028 | |
| Closed | Lorick Sonja Lanell | -- |
Source: Public Records
Tax History Compared to Growth
Tax History
| Year | Tax Paid | Tax Assessment Tax Assessment Total Assessment is a certain percentage of the fair market value that is determined by local assessors to be the total taxable value of land and additions on the property. | Land | Improvement |
|---|---|---|---|---|
| 2025 | $4,657 | $307,233 | $0 | $0 |
| 2024 | $4,657 | $294,100 | $145,000 | $149,100 |
| 2023 | $4,264 | $270,267 | $0 | $0 |
| 2022 | $3,881 | $246,433 | $0 | $0 |
| 2021 | $3,539 | $222,600 | $80,000 | $142,600 |
| 2020 | $3,519 | $221,233 | $0 | $0 |
| 2019 | $3,499 | $219,867 | $0 | $0 |
| 2018 | $3,260 | $218,500 | $78,000 | $140,500 |
| 2017 | $3,149 | $218,500 | $0 | $0 |
| 2016 | $608 | $203,967 | $0 | $0 |
| 2015 | $608 | $196,700 | $0 | $0 |
| 2014 | $593 | $196,700 | $0 | $0 |
Source: Public Records
Map
Nearby Homes
- 10572 Twin Rivers Rd Unit D1
- 10570 Twin Rivers Rd Unit D1
- 10580 Cross Fox Ln
- 5495 Endicott Ln
- 10540 Faulkner Ridge Cir
- 10472 Faulkner Ridge Cir
- 10672 Green Mountain Cir
- 10547 Twin Rivers Rd Unit C2
- 10534 Faulkner Ridge Cir
- 10662 Green Mountain Cir
- 5418 Hesperus Dr
- 10850 Green Mountain Cir Unit 411
- 10850 Green Mountain Cir Unit 705
- 5627 Harpers Farm Rd Unit C
- 5633 Harpers Farm Rd Unit B
- 5356 Hesperus Dr
- 5416 Morning Glory Ct
- 5443 Hildebrand Ct
- 5324 Eliots Oak Rd
- 5007 Green Mountain Cir Unit 5
- 10536 Jason Ln
- 10534 Jason Ln
- 10542 Jason Ln
- 10544 Jason Ln
- 10532 Jason Ln
- 10548 Jason Ln
- 10527 Tolling Clock Way
- 10531 Tolling Clock Way
- 10533 Tolling Clock Way
- 10525 Tolling Clock Way
- 10550 Jason Ln
- 10535 Tolling Clock Way
- 10539 Jason Ln
- 10541 Jason Ln
- 10537 Tolling Clock Way
- 10552 Jason Ln
- 10543 Jason Ln
- 10545 Jason Ln
- 10523 Tolling Clock Way
- 10539 Tolling Clock Way