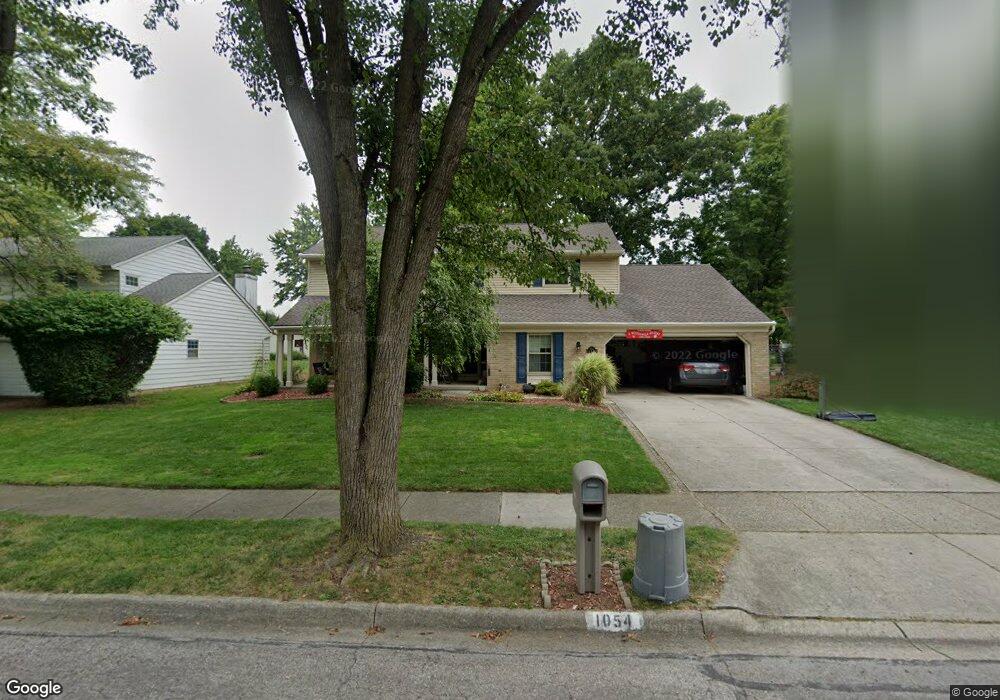
1054 Arundel Ave Westerville, OH 43081
Estimated Value: $440,000 - $500,000
4
Beds
3
Baths
2,475
Sq Ft
$190/Sq Ft
Est. Value
About This Home
This home is located at 1054 Arundel Ave, Westerville, OH 43081 and is currently estimated at $470,927, approximately $190 per square foot. 1054 Arundel Ave is a home located in Franklin County with nearby schools including Annehurst Elementary School, Heritage Middle School, and Westerville South High School.
Ownership History
Date
Name
Owned For
Owner Type
Purchase Details
Closed on
Jun 14, 2006
Sold by
Koval Erik T and Koval Jennifer R
Bought by
Koval Erik T and Koval Jennifer R
Current Estimated Value
Purchase Details
Closed on
Dec 20, 2005
Sold by
Fannie Mae
Bought by
Koval Erik T and Koval Jennifer R
Home Financials for this Owner
Home Financials are based on the most recent Mortgage that was taken out on this home.
Original Mortgage
$116,500
Outstanding Balance
$65,608
Interest Rate
6.4%
Mortgage Type
Purchase Money Mortgage
Estimated Equity
$405,319
Purchase Details
Closed on
Jul 18, 2005
Sold by
Riegel Daniel E
Bought by
Federal National Mortgage Association
Purchase Details
Closed on
Oct 7, 1986
Bought by
Riegel Daniel E and Riegel Paula N
Purchase Details
Closed on
Feb 1, 1980
Create a Home Valuation Report for This Property
The Home Valuation Report is an in-depth analysis detailing your home's value as well as a comparison with similar homes in the area
Home Values in the Area
Average Home Value in this Area
Purchase History
| Date | Buyer | Sale Price | Title Company |
|---|---|---|---|
| Koval Erik T | -- | None Available | |
| Koval Erik T | $196,000 | Title First | |
| Federal National Mortgage Association | $180,000 | -- | |
| Riegel Daniel E | $111,400 | -- | |
| -- | $88,000 | -- |
Source: Public Records
Mortgage History
| Date | Status | Borrower | Loan Amount |
|---|---|---|---|
| Open | Koval Erik T | $116,500 |
Source: Public Records
Tax History Compared to Growth
Tax History
| Year | Tax Paid | Tax Assessment Tax Assessment Total Assessment is a certain percentage of the fair market value that is determined by local assessors to be the total taxable value of land and additions on the property. | Land | Improvement |
|---|---|---|---|---|
| 2024 | $7,988 | $140,560 | $29,750 | $110,810 |
| 2023 | $7,819 | $140,560 | $29,750 | $110,810 |
| 2022 | $6,832 | $93,770 | $18,480 | $75,290 |
| 2021 | $6,889 | $93,770 | $18,480 | $75,290 |
| 2020 | $6,869 | $93,770 | $18,480 | $75,290 |
| 2019 | $6,228 | $80,260 | $18,480 | $61,780 |
| 2018 | $6,024 | $80,260 | $18,480 | $61,780 |
| 2017 | $6,131 | $80,260 | $18,480 | $61,780 |
| 2016 | $6,136 | $73,190 | $18,060 | $55,130 |
| 2015 | $5,943 | $73,190 | $18,060 | $55,130 |
| 2014 | $5,637 | $69,370 | $18,060 | $51,310 |
| 2013 | $2,815 | $69,370 | $18,060 | $51,310 |
Source: Public Records
Map
Nearby Homes
- 106 Ormsbee Ave
- 258 Bellefield Ave
- 1095 Belle Meade Place
- 953 Arcadia Blvd
- 1024 Arcadia Blvd
- 828 Memories Ln
- 7691 Key Deer Dr
- 7685 Key Deer Dr Unit 7685
- 774 W Main St
- 8278 Mira St Unit 154
- 8282 Mira St Unit 153
- 1585 Fawn Ct
- 658 River Trace
- 8292 Carano Way Unit 39
- 640 Glacier Pass
- 671 College Crest Rd
- 1296 Blacksmith Dr
- 7852 Heathcock Ct
- 0 Olde Worthington Rd
- 1192 Blacksmith Dr
- 1060 Arundel Ave
- 1046 Arundel Ave
- 1019 Danvers Ave
- 1061 Hepplewhite St
- 1045 Hepplewhite St
- 1055 Arundel Ave
- 1045 Arundel Ave
- 1066 Arundel Ave
- 1065 Hepplewhite St
- 1071 Arundel Ave
- 1078 Arundel Ave
- 995 Danvers Ave
- 1071 Hepplewhite St
- 1012 Danvers Ave
- 1020 Danvers Ave
- 1077 Arundel Ave
- 1056 Hepplewhite St
- 1050 Hepplewhite St
- 1028 Danvers Ave
- 1086 Arundel Ave