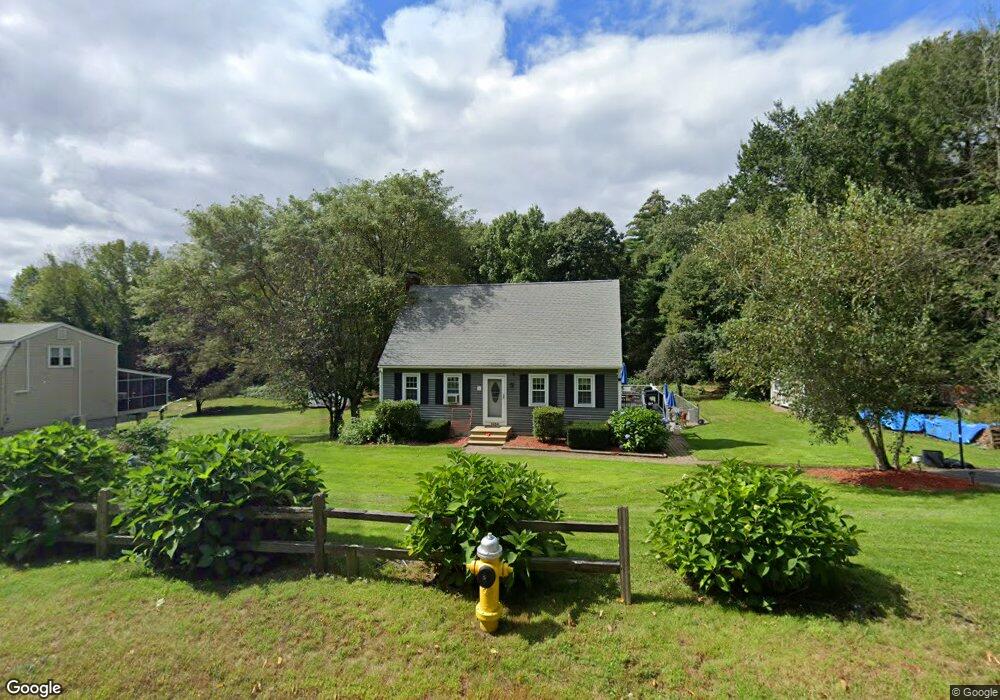
1054 Dennison Dr Southbridge, MA 01550
Estimated Value: $432,073 - $502,000
3
Beds
2
Baths
1,732
Sq Ft
$265/Sq Ft
Est. Value
About This Home
This home is located at 1054 Dennison Dr, Southbridge, MA 01550 and is currently estimated at $459,018, approximately $265 per square foot. 1054 Dennison Dr is a home located in Worcester County with nearby schools including Trinity Catholic Academy and ViewPoint Christian Academy.
Ownership History
Date
Name
Owned For
Owner Type
Purchase Details
Closed on
Aug 30, 2011
Sold by
Snyder Deborah L and Kenaley Patricia A
Bought by
Gamache Amy C and Kreidemaker Patrick
Current Estimated Value
Home Financials for this Owner
Home Financials are based on the most recent Mortgage that was taken out on this home.
Original Mortgage
$195,904
Outstanding Balance
$135,872
Interest Rate
4.53%
Mortgage Type
Purchase Money Mortgage
Estimated Equity
$323,146
Purchase Details
Closed on
Jan 2, 1996
Sold by
Snyder Deborah
Bought by
Kenaley Patricia
Create a Home Valuation Report for This Property
The Home Valuation Report is an in-depth analysis detailing your home's value as well as a comparison with similar homes in the area
Home Values in the Area
Average Home Value in this Area
Purchase History
| Date | Buyer | Sale Price | Title Company |
|---|---|---|---|
| Gamache Amy C | $201,000 | -- | |
| Gamache Amy C | $201,000 | -- | |
| Kenaley Patricia | $45,000 | -- | |
| Kenaley Patricia | $45,000 | -- |
Source: Public Records
Mortgage History
| Date | Status | Borrower | Loan Amount |
|---|---|---|---|
| Open | Gamache Amy C | $195,904 | |
| Closed | Kenaley Patricia | $195,904 | |
| Previous Owner | Kenaley Patricia | $65,000 | |
| Previous Owner | Kenaley Patricia | $35,000 |
Source: Public Records
Tax History Compared to Growth
Tax History
| Year | Tax Paid | Tax Assessment Tax Assessment Total Assessment is a certain percentage of the fair market value that is determined by local assessors to be the total taxable value of land and additions on the property. | Land | Improvement |
|---|---|---|---|---|
| 2025 | $5,653 | $385,600 | $48,900 | $336,700 |
| 2024 | $5,269 | $345,300 | $40,800 | $304,500 |
| 2023 | $5,146 | $324,900 | $40,800 | $284,100 |
| 2022 | $4,883 | $272,800 | $34,900 | $237,900 |
| 2021 | $4,944 | $254,300 | $34,900 | $219,400 |
| 2020 | $4,593 | $235,800 | $34,900 | $200,900 |
| 2018 | $4,162 | $200,600 | $34,900 | $165,700 |
| 2017 | $4,180 | $203,200 | $34,900 | $168,300 |
| 2016 | $3,959 | $195,900 | $40,100 | $155,800 |
| 2015 | $3,989 | $195,900 | $40,100 | $155,800 |
| 2014 | $3,710 | $188,900 | $40,100 | $148,800 |
Source: Public Records
Map
Nearby Homes
- 28 Servant Way
- 48 Dennison Hill Rd
- 691 Dennison Dr
- 389 Breakneck Rd
- 80 Alpine Dr
- 0 Alpine Dr
- 22 Jacobs Rd
- 467 Durfee St
- 504 Alpine Dr
- 444 Dennison Dr
- 0 Lebanon Hill Rd
- 15 Bruce Ln
- 28 Maria Ave Unit D
- 89 Stony Brook Dr
- 29 Hudson Ave
- 36 Litchfield Ave
- 34 South Rd
- 25 Cohasse St
- 0 Brentwood Dr
- 152 Chapin St
- 1060 Dennison Dr
- 1034 Dennison Dr
- 1047 Dennison Dr
- 1061 Dennison Dr
- lot 0 Dennison Lot
- 1020 Dennison Dr
- 1075 Dennison Dr
- 1023 Dennison Dr
- 1066 Dennison Dr
- 1004 Dennison Dr
- 1089 Dennison Dr
- 994 Dennison Dr
- 1110 Dennison Dr
- 987 Dennison Dr
- 1003 Dennison Dr
- 1107 Dennison Dr
- 810 Eastford Rd
- 756 Eastford Rd
- 950 Dennison Dr
- 732 Eastford Rd