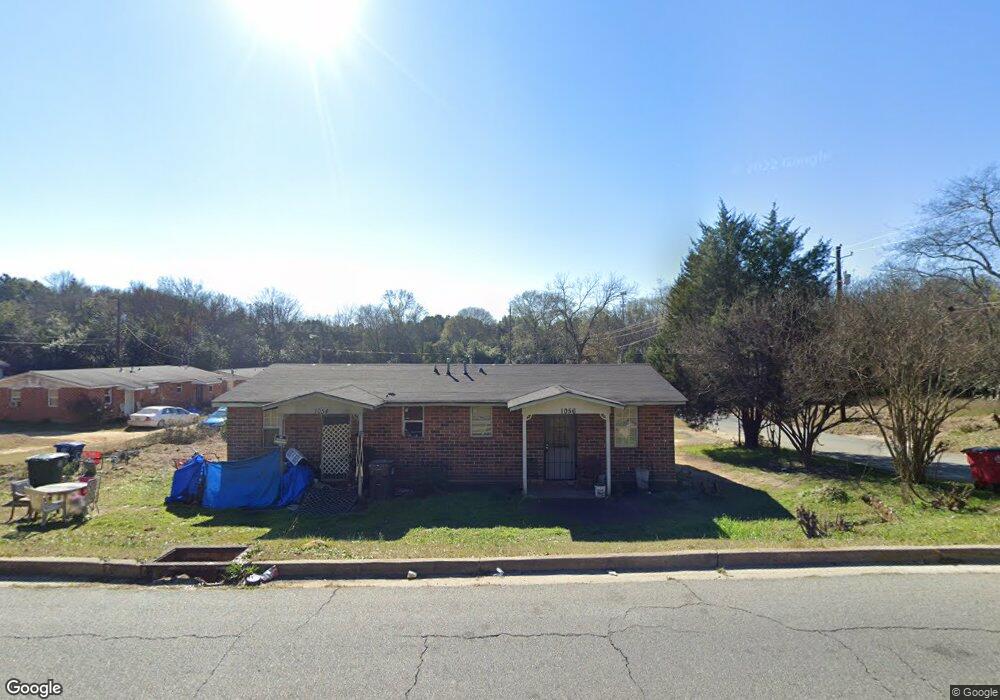
1054 Ell St Unit 1056 Macon, GA 31206
Estimated Value: $73,491 - $90,000
4
Beds
2
Baths
1,125
Sq Ft
$75/Sq Ft
Est. Value
About This Home
This home is located at 1054 Ell St Unit 1056, Macon, GA 31206 and is currently estimated at $84,623, approximately $75 per square foot. 1054 Ell St Unit 1056 is a home located in Bibb County with nearby schools including Hartley Elementary School, Southwest High School, and Cirrus Charter Academy.
Ownership History
Date
Name
Owned For
Owner Type
Purchase Details
Closed on
Apr 5, 2012
Sold by
Robins Federal Credit Union
Bought by
Somma Investments Inc
Current Estimated Value
Purchase Details
Closed on
Nov 1, 2011
Sold by
Lance Kevin
Bought by
Robins Federal Credit Union
Purchase Details
Closed on
Sep 21, 2007
Sold by
Douglas Chimain
Bought by
Lance Kevin
Purchase Details
Closed on
Dec 2, 2006
Sold by
W I N Group Investment Group Llc
Bought by
Douglas Chimain
Purchase Details
Closed on
Jul 5, 2005
Purchase Details
Closed on
Jan 16, 2004
Purchase Details
Closed on
Sep 2, 2003
Purchase Details
Closed on
Feb 19, 2002
Purchase Details
Closed on
Jul 5, 2001
Create a Home Valuation Report for This Property
The Home Valuation Report is an in-depth analysis detailing your home's value as well as a comparison with similar homes in the area
Home Values in the Area
Average Home Value in this Area
Purchase History
| Date | Buyer | Sale Price | Title Company |
|---|---|---|---|
| Somma Investments Inc | $9,000 | None Available | |
| Somma Investments Inc | $9,000 | None Available | |
| Robins Federal Credit Union | $7,000 | None Available | |
| Robins Federal Credit Union | $7,000 | None Available | |
| Lance Kevin | $10,000 | None Available | |
| Lance Kevin | $10,000 | None Available | |
| Douglas Chimain | -- | None Avilabale | |
| Douglas Chimain | -- | None Avilabale | |
| -- | $9,900 | -- | |
| -- | $9,900 | -- | |
| -- | -- | -- | |
| -- | -- | -- | |
| -- | $49,400 | -- | |
| -- | $49,400 | -- | |
| -- | $65,000 | -- | |
| -- | $65,000 | -- | |
| -- | $48,000 | -- | |
| -- | $48,000 | -- |
Source: Public Records
Tax History Compared to Growth
Tax History
| Year | Tax Paid | Tax Assessment Tax Assessment Total Assessment is a certain percentage of the fair market value that is determined by local assessors to be the total taxable value of land and additions on the property. | Land | Improvement |
|---|---|---|---|---|
| 2025 | $136 | $5,538 | $2,244 | $3,294 |
| 2024 | $139 | $5,454 | $2,244 | $3,210 |
| 2023 | $123 | $4,831 | $2,040 | $2,791 |
| 2022 | $307 | $8,875 | $1,767 | $7,108 |
| 2021 | $177 | $4,655 | $1,473 | $3,182 |
| 2020 | $181 | $4,655 | $1,473 | $3,182 |
| 2019 | $182 | $4,655 | $1,473 | $3,182 |
| 2018 | $639 | $4,655 | $1,473 | $3,182 |
| 2017 | $174 | $4,655 | $1,473 | $3,182 |
| 2016 | $156 | $4,655 | $1,473 | $3,182 |
| 2015 | $259 | $5,292 | $1,473 | $3,819 |
| 2014 | $298 | $5,292 | $1,473 | $3,819 |
Source: Public Records
Map
Nearby Homes