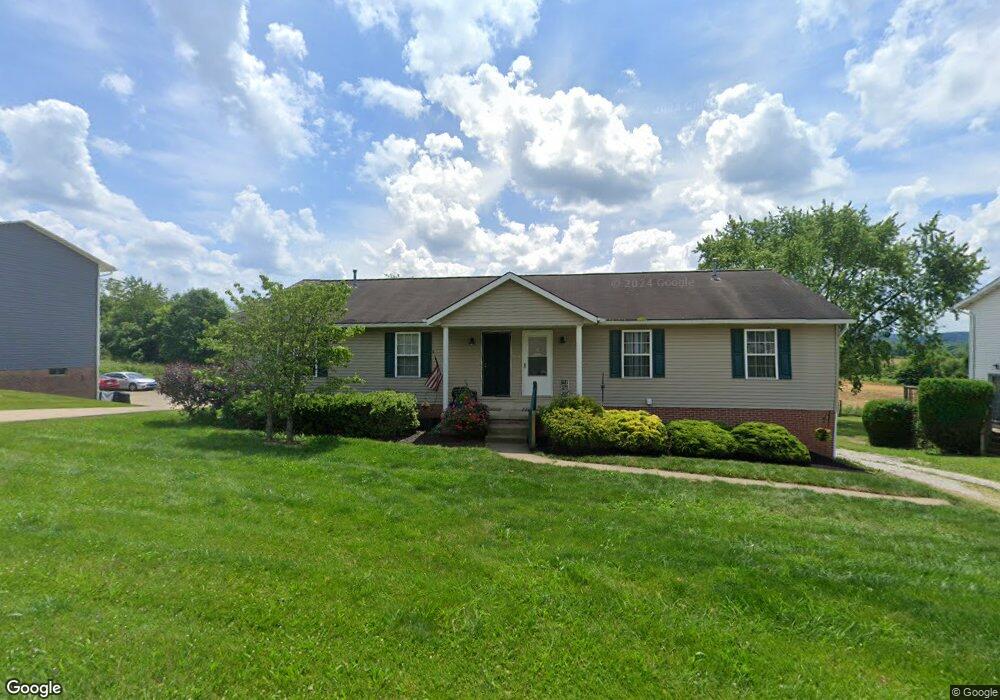
1054 Kerns Dr NE Unit A Bolivar, OH 44612
Estimated Value: $211,000 - $245,000
4
Beds
2
Baths
1,984
Sq Ft
$116/Sq Ft
Est. Value
About This Home
This home is located at 1054 Kerns Dr NE Unit A, Bolivar, OH 44612 and is currently estimated at $230,725, approximately $116 per square foot. 1054 Kerns Dr NE Unit A is a home located in Tuscarawas County with nearby schools including Tuscarawas Valley Primary School, Tuscarawas Valley Intermediate School, and Tuscarawas Valley Middle School.
Ownership History
Date
Name
Owned For
Owner Type
Purchase Details
Closed on
May 21, 2021
Sold by
Wallace Rodney P
Bought by
Lk1 Investments Llc
Current Estimated Value
Home Financials for this Owner
Home Financials are based on the most recent Mortgage that was taken out on this home.
Original Mortgage
$131,000
Outstanding Balance
$118,719
Interest Rate
3.1%
Mortgage Type
Future Advance Clause Open End Mortgage
Estimated Equity
$112,006
Purchase Details
Closed on
Oct 30, 1996
Sold by
Pedersen Fred W
Bought by
Wallace Rodney P
Home Financials for this Owner
Home Financials are based on the most recent Mortgage that was taken out on this home.
Original Mortgage
$109,400
Interest Rate
7.63%
Mortgage Type
New Conventional
Purchase Details
Closed on
Feb 2, 1994
Sold by
Myers Ii Kent
Bought by
Pederson Fred W and Locke Mark E
Purchase Details
Closed on
Apr 1, 1993
Sold by
Teel Daphanie B
Bought by
Wallace Rodney P
Create a Home Valuation Report for This Property
The Home Valuation Report is an in-depth analysis detailing your home's value as well as a comparison with similar homes in the area
Home Values in the Area
Average Home Value in this Area
Purchase History
| Date | Buyer | Sale Price | Title Company |
|---|---|---|---|
| Lk1 Investments Llc | $155,000 | Alban Title | |
| Wallace Rodney P | $115,250 | -- | |
| Pederson Fred W | $7,500 | -- | |
| Wallace Rodney P | $7,500 | -- |
Source: Public Records
Mortgage History
| Date | Status | Borrower | Loan Amount |
|---|---|---|---|
| Open | Lk1 Investments Llc | $131,000 | |
| Previous Owner | Wallace Rodney P | $109,400 |
Source: Public Records
Tax History Compared to Growth
Tax History
| Year | Tax Paid | Tax Assessment Tax Assessment Total Assessment is a certain percentage of the fair market value that is determined by local assessors to be the total taxable value of land and additions on the property. | Land | Improvement |
|---|---|---|---|---|
| 2024 | $2,587 | $52,830 | $8,820 | $44,010 |
| 2023 | $2,587 | $150,930 | $25,200 | $125,730 |
| 2022 | $2,565 | $52,826 | $8,820 | $44,006 |
| 2021 | $2,423 | $47,548 | $5,607 | $41,941 |
| 2020 | $2,544 | $47,548 | $5,607 | $41,941 |
| 2019 | $2,294 | $47,548 | $5,607 | $41,941 |
| 2018 | $2,439 | $47,550 | $5,610 | $41,940 |
| 2017 | $2,450 | $47,550 | $5,610 | $41,940 |
| 2016 | $2,436 | $47,550 | $5,610 | $41,940 |
| 2014 | $2,384 | $43,810 | $4,730 | $39,080 |
| 2013 | $1,960 | $43,810 | $4,730 | $39,080 |
Source: Public Records
Map
Nearby Homes
- 0 Kerns Dr NE
- 797 Glenda St NE
- 720 Holly St NE
- 10419 Laurens Dr NE
- 827 Melissa St NE
- 10884 Madlyn St NE
- 10952 Madlyn St NE
- 10988 Madlyn St NE
- 0 State Route 212 Unit 4441887
- 11275 Indian Hills Dr NE
- 11162 Northwood Ave NE
- 11121 Northwood Ave NE
- VL Hess Mill Rd NE
- 11167 Northwood Ave NE
- 379 Olde Orchard Dr NE
- 1557 N Orchard Rd NE
- 1517 NE North Orchard Rd
- 1678 N Orchard Rd NE
- 1750 N Orchard Rd NE
- 1001 Mill Circle Dr NE
- 1036 Kerns Dr NE Unit A
- 1072 Kerns Dr NE Unit A
- 1018 Kerns Dr NE Unit A
- 1037 Kerns Dr NE
- 1055 Kerns Dr NE Unit B
- 1077 Kerns Dr NE Unit B
- 1011 Kerns Dr NE Unit A
- 1116 Kerns Dr NE Unit C
- 1116 Kerns Dr NE
- 994 Kerns Dr NE
- 1142 Kerns Dr NE Unit B
- 1039 Kerns Dr NE
- 1023 Kerns Dr NE
- 974 Kerns Dr NE Unit A
- 10770 N Laurens Square NE
- 907 Kerns Dr NE
- 10758 N Laurens Square NE
- 10780 N Laurens Square NE
- 10794 N Laurens Square NE
- 10738 Laurens Square NE