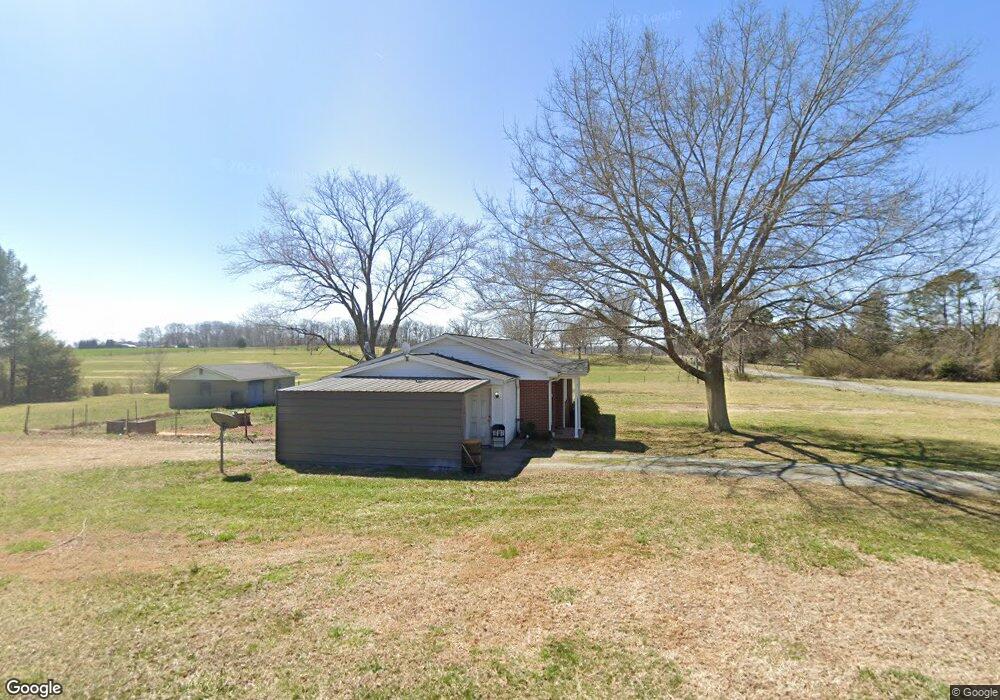
1054 Mooresboro Rd Shelby, NC 28150
Estimated Value: $163,379 - $240,000
--
Bed
--
Bath
1,130
Sq Ft
$170/Sq Ft
Est. Value
About This Home
This home is located at 1054 Mooresboro Rd, Shelby, NC 28150 and is currently estimated at $191,845, approximately $169 per square foot. 1054 Mooresboro Rd is a home located in Cleveland County with nearby schools including Union Elementary School, Burns Middle, and Burns High School.
Ownership History
Date
Name
Owned For
Owner Type
Purchase Details
Closed on
Feb 21, 2019
Sold by
Hamrick Jon Michael and Hamrick Allison
Bought by
Earth Ware Farms Llc
Current Estimated Value
Purchase Details
Closed on
Jan 8, 2015
Sold by
Allen Linda
Bought by
Hamrick Jon Michael
Home Financials for this Owner
Home Financials are based on the most recent Mortgage that was taken out on this home.
Original Mortgage
$43,877
Interest Rate
4.04%
Mortgage Type
FHA
Purchase Details
Closed on
Feb 28, 2013
Sold by
Cfa M Inc
Bought by
Allen Linda
Purchase Details
Closed on
Feb 27, 2013
Sold by
Cfa M Inc
Bought by
Allen Linda
Purchase Details
Closed on
Dec 11, 2012
Sold by
Hsbc Mortgage Services Inc
Bought by
Cfa-M Inc
Purchase Details
Closed on
Aug 28, 2012
Sold by
Whitaker Tracy James
Bought by
Hsbc Mortgage Services Inc
Create a Home Valuation Report for This Property
The Home Valuation Report is an in-depth analysis detailing your home's value as well as a comparison with similar homes in the area
Home Values in the Area
Average Home Value in this Area
Purchase History
| Date | Buyer | Sale Price | Title Company |
|---|---|---|---|
| Earth Ware Farms Llc | $115,000 | None Available | |
| Hamrick Jon Michael | $43,000 | None Available | |
| Allen Linda | $43,000 | None Available | |
| Allen Linda | $43,000 | None Available | |
| Cfa-M Inc | $27,000 | None Available | |
| Hsbc Mortgage Services Inc | $33,099 | None Available |
Source: Public Records
Mortgage History
| Date | Status | Borrower | Loan Amount |
|---|---|---|---|
| Previous Owner | Hamrick Jon Michael | $43,877 |
Source: Public Records
Tax History Compared to Growth
Tax History
| Year | Tax Paid | Tax Assessment Tax Assessment Total Assessment is a certain percentage of the fair market value that is determined by local assessors to be the total taxable value of land and additions on the property. | Land | Improvement |
|---|---|---|---|---|
| 2025 | $881 | $138,729 | $15,350 | $123,379 |
| 2024 | $607 | $73,152 | $12,472 | $60,680 |
| 2023 | $604 | $73,152 | $12,472 | $60,680 |
| 2022 | $604 | $73,152 | $12,472 | $60,680 |
| 2021 | $607 | $73,152 | $12,472 | $60,680 |
| 2020 | $591 | $62,477 | $12,472 | $50,005 |
| 2019 | $591 | $62,477 | $12,472 | $50,005 |
| 2018 | $586 | $62,477 | $12,472 | $50,005 |
| 2017 | $584 | $62,477 | $12,472 | $50,005 |
| 2016 | $556 | $62,477 | $12,472 | $50,005 |
| 2015 | $602 | $68,332 | $12,472 | $55,860 |
| 2014 | $602 | $68,332 | $12,472 | $55,860 |
Source: Public Records
Map
Nearby Homes
- 3319 Humphries Rd
- 109 Vintage Woods Ln
- 109 Vintage Woods Ct
- NA New House Rd
- 382 Poole Rd
- 3110 W Zion Church Rd
- 3105 W Zion Church Rd
- 0 New Covenant Way
- 560 Hopewell Rd
- 221 Red Barn Rd
- 107 Toney Hill Dr
- 2026 Rehobeth Church Rd
- 796 Hollis Rd
- 1642 Rehobeth Church Rd
- 314 Right Prong Rd
- 000 New House Rd
- 000 Campfield Church Rd
- 579 Hollis Rd
- 1246 Bob Falls Rd
- 00 Lattimore Rd
- 1050 Mooresboro Rd
- 1044 Mooresboro Rd
- 1102 Mooresboro Rd
- 1053 Mooresboro Rd
- 1105 Mooresboro Rd
- 3375 Humphries Rd
- 3377 Humphries Rd
- 1112 Mooresboro Rd
- 3367 Humphries Rd
- 3363 Humphries Rd
- 1201 Mooresboro Rd
- 3359 Humphries Rd Unit 1
- 1207 Mooresboro Rd
- 1043 Mooresboro Rd
- 3357 Humphries Rd
- 1209 Mooresboro Rd
- 1211 Mooresboro Rd
- 3353 Humphries Rd
- 1208 Mooresboro Rd
- 1047 Mooresboro Rd