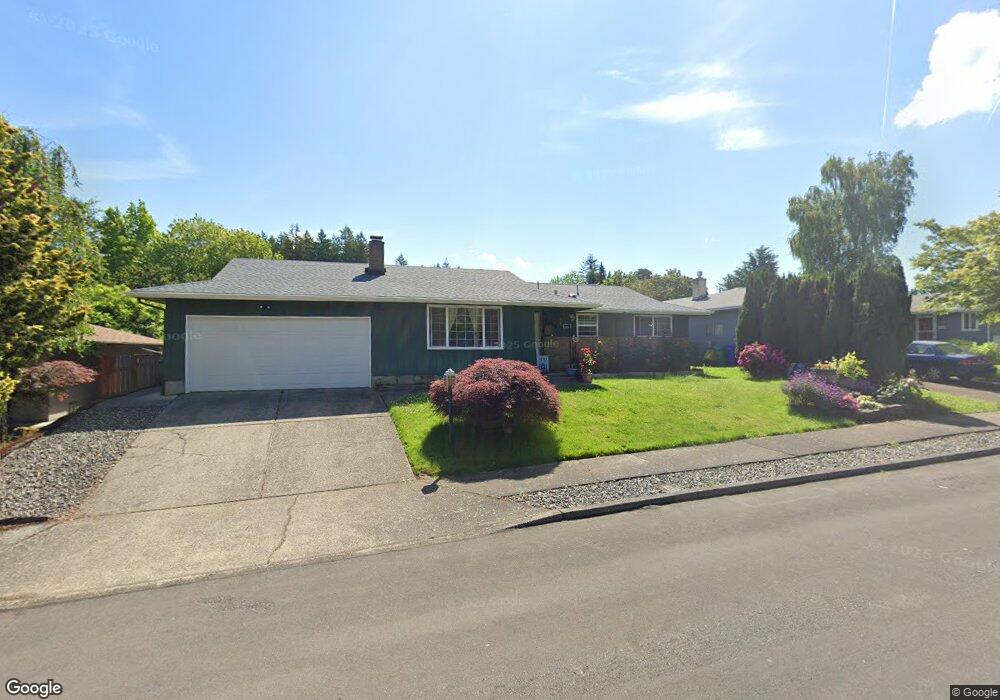
1054 SE 213th Ave Gresham, OR 97030
North Central NeighborhoodEstimated Value: $454,000 - $475,078
3
Beds
3
Baths
1,884
Sq Ft
$246/Sq Ft
Est. Value
About This Home
This home is located at 1054 SE 213th Ave, Gresham, OR 97030 and is currently estimated at $462,770, approximately $245 per square foot. 1054 SE 213th Ave is a home located in Multnomah County with nearby schools including North Gresham Elementary School, Clear Creek Middle School, and Gresham High School.
Ownership History
Date
Name
Owned For
Owner Type
Purchase Details
Closed on
Aug 23, 2012
Sold by
Wilken Ernest
Bought by
Wilken Ernest and Wilken Linda Sue
Current Estimated Value
Purchase Details
Closed on
Oct 20, 2006
Sold by
Reinders Shannon
Bought by
Kuca John A and Kuca Luray A Hodder
Home Financials for this Owner
Home Financials are based on the most recent Mortgage that was taken out on this home.
Original Mortgage
$228,000
Outstanding Balance
$135,349
Interest Rate
6.46%
Mortgage Type
Purchase Money Mortgage
Estimated Equity
$327,421
Purchase Details
Closed on
Jul 19, 2005
Sold by
Wilken Ernest
Bought by
Sherab Tenzin and Tsering Tenzin
Home Financials for this Owner
Home Financials are based on the most recent Mortgage that was taken out on this home.
Original Mortgage
$156,000
Interest Rate
5.51%
Mortgage Type
Fannie Mae Freddie Mac
Purchase Details
Closed on
Sep 5, 1995
Sold by
Wilken Ernest
Bought by
Wilken Ernest and The Ernest Wilken Revocable Living Trust
Create a Home Valuation Report for This Property
The Home Valuation Report is an in-depth analysis detailing your home's value as well as a comparison with similar homes in the area
Home Values in the Area
Average Home Value in this Area
Purchase History
| Date | Buyer | Sale Price | Title Company |
|---|---|---|---|
| Wilken Ernest | -- | First American | |
| Kuca John A | $285,000 | Pacific Nw Title | |
| Sherab Tenzin | $195,000 | First American | |
| Wilken Ernest | -- | -- |
Source: Public Records
Mortgage History
| Date | Status | Borrower | Loan Amount |
|---|---|---|---|
| Open | Kuca John A | $228,000 | |
| Previous Owner | Sherab Tenzin | $156,000 |
Source: Public Records
Tax History
| Year | Tax Paid | Tax Assessment Tax Assessment Total Assessment is a certain percentage of the fair market value that is determined by local assessors to be the total taxable value of land and additions on the property. | Land | Improvement |
|---|---|---|---|---|
| 2025 | $4,994 | $245,420 | -- | -- |
| 2024 | $4,781 | $238,280 | -- | -- |
| 2023 | $4,356 | $231,340 | $0 | $0 |
| 2022 | $4,234 | $224,610 | $0 | $0 |
| 2021 | $4,127 | $218,070 | $0 | $0 |
| 2020 | $3,883 | $211,720 | $0 | $0 |
| 2019 | $3,782 | $205,560 | $0 | $0 |
| 2018 | $3,606 | $199,580 | $0 | $0 |
| 2017 | $4,355 | $193,770 | $0 | $0 |
| 2016 | $2,598 | $160,210 | $0 | $0 |
Source: Public Records
Map
Nearby Homes
- 21532 SE Alder St
- 21033 SE Clay Ct
- 21400 SE Stark St Unit 2
- 21260 SE Stark St
- 21016 SE Stark St Unit 71
- 21016 SE Stark St Unit 69
- 2013 NW Bella Vista Dr
- 1811 NW 19th St
- 21525 SE Oak St
- 209 SE 214th Ave
- 1861 NW Wonderview Ave
- 132 SE 214th Ave
- 21553 SE Ankeny Terrace
- 210 SE 218th Ave
- 1035 SE 225th Ave
- 1596 NW Riverview Ave
- 1325 NW 9th St
- 0 SE Burnside St
- 70 NW Birdsdale Ave
- 522 SE 199th Ave
- 1112 SE 213th Ave
- 1050 SE 213th Ave
- 1107 SE 214th Ave
- 1121 SE 214th Ave
- 1075 SE 214th Ave
- 1053 SE 213th Ave
- 1034 SE 213th Ave
- 1109 SE 213th Ave
- 1047 SE 213th Ave
- 1133 SE 214th Ave
- 1067 SE 214th Ave
- 1127 SE 213th Ave
- 1035 SE 213th Ave
- 1144 SE 213th Ave
- 1141 SE 214th Ave
- 1108 SE 214th Ave
- 1124 SE 214th Ave
- 1078 SE 214th Ave
- 1143 SE 213th Ave
Your Personal Tour Guide
Ask me questions while you tour the home.