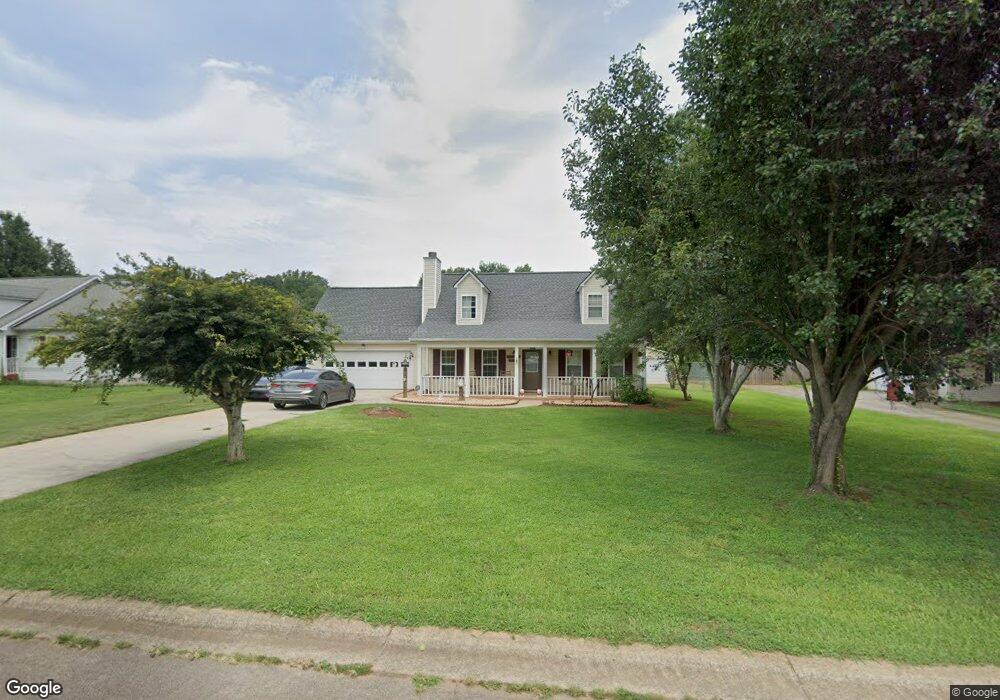
1054 Taylor Ct Unit 2 Winder, GA 30680
Estimated Value: $308,988 - $339,000
3
Beds
3
Baths
1,362
Sq Ft
$240/Sq Ft
Est. Value
About This Home
This home is located at 1054 Taylor Ct Unit 2, Winder, GA 30680 and is currently estimated at $326,747, approximately $239 per square foot. 1054 Taylor Ct Unit 2 is a home located in Barrow County with nearby schools including Holsenbeck Elementary School, Bear Creek Middle School, and Winder-Barrow High School.
Ownership History
Date
Name
Owned For
Owner Type
Purchase Details
Closed on
Nov 12, 2003
Sold by
Kennedy Stanley N
Bought by
Kennedy Stanley N and Kennedy Susan
Current Estimated Value
Home Financials for this Owner
Home Financials are based on the most recent Mortgage that was taken out on this home.
Original Mortgage
$99,073
Outstanding Balance
$45,707
Interest Rate
5.93%
Mortgage Type
FHA
Estimated Equity
$281,040
Purchase Details
Closed on
May 20, 1999
Sold by
Bradley Daniel
Bought by
Kennedy Stanley N
Home Financials for this Owner
Home Financials are based on the most recent Mortgage that was taken out on this home.
Original Mortgage
$98,091
Interest Rate
6.87%
Mortgage Type
FHA
Purchase Details
Closed on
Nov 18, 1998
Sold by
Patterson Phillip R and Patterson Brenda E
Bought by
Bradley Daniel
Home Financials for this Owner
Home Financials are based on the most recent Mortgage that was taken out on this home.
Original Mortgage
$80,000
Interest Rate
6.47%
Mortgage Type
Construction
Purchase Details
Closed on
May 22, 1980
Bought by
Patterson Ray and Patterson Bren
Create a Home Valuation Report for This Property
The Home Valuation Report is an in-depth analysis detailing your home's value as well as a comparison with similar homes in the area
Home Values in the Area
Average Home Value in this Area
Purchase History
| Date | Buyer | Sale Price | Title Company |
|---|---|---|---|
| Kennedy Stanley N | -- | -- | |
| Kennedy Stanley N | $98,900 | -- | |
| Bradley Daniel | $16,000 | -- | |
| Patterson Ray | -- | -- |
Source: Public Records
Mortgage History
| Date | Status | Borrower | Loan Amount |
|---|---|---|---|
| Open | Kennedy Stanley N | $99,073 | |
| Previous Owner | Kennedy Stanley N | $98,091 | |
| Previous Owner | Bradley Daniel | $80,000 |
Source: Public Records
Tax History Compared to Growth
Tax History
| Year | Tax Paid | Tax Assessment Tax Assessment Total Assessment is a certain percentage of the fair market value that is determined by local assessors to be the total taxable value of land and additions on the property. | Land | Improvement |
|---|---|---|---|---|
| 2024 | $745 | $90,114 | $24,000 | $66,114 |
| 2023 | $392 | $73,532 | $18,000 | $55,532 |
| 2022 | $509 | $60,451 | $16,000 | $44,451 |
| 2021 | $535 | $60,451 | $16,000 | $44,451 |
| 2020 | $521 | $60,451 | $16,000 | $44,451 |
| 2019 | $1,736 | $60,451 | $16,000 | $44,451 |
| 2018 | $1,574 | $54,546 | $12,000 | $42,546 |
| 2017 | $1,238 | $42,506 | $12,000 | $30,506 |
| 2016 | $1,226 | $42,858 | $12,000 | $30,858 |
| 2015 | $1,242 | $43,209 | $12,000 | $31,209 |
| 2014 | $1,074 | $37,441 | $5,880 | $31,561 |
| 2013 | -- | $35,602 | $5,880 | $29,722 |
Source: Public Records
Map
Nearby Homes
- 388 Kay Dr Unit 1
- 1206 Corkybrooke Ln
- 917 Justin Dr Unit 3
- 1556 Shoal Creek Dr
- 1553 Shoal Creek Dr
- 508 Pleasant Hill Church Rd NE
- 1212 Highway 211 NE
- 1226 Highway 211 NE
- 867 Windward Rd
- 0 Hancock Bridge Rd Unit 10535063
- 63 Delightful Way Unit 1
- 130 (Tract 1) Bowman Mill Rd NE
- 130 Bowman Mill Rd NE Unit 1
- 162 Delightful Way Unit 28
- 203 Delightful Way Unit 5
- 330 Anchors Way
- 253 Delightful Way Unit 6
- 230 Delightful Way Unit 23
- 281 Delightful Way Unit 7
- 296 Delightful Way Unit 22
- 1056 Taylor Ct Unit 24
- 1056 Taylor Ct Unit 2
- 1056 Taylor Ct
- 1052 Taylor Ct Unit 2
- 715 Taylor Ct Unit 20
- 733 Taylor Ct Unit 27
- 737 Taylor Ct Unit 29
- 739 Taylor Ct Unit 30
- 751 Taylor Ct Unit 33
- 751 Taylor Ct
- 1058 Taylor Ct
- 709 Taylor Ct Unit 18
- 719 Taylor Ct Unit 22
- 385 Kay Dr Unit 1
- 500 Stoney Creek Dr
- 1053 Taylor Ct
- 500 Stoney Creek Rd
- 1060 Taylor Ct Unit II
- 1055 Taylor Ct
- 1055 Taylor Ct Unit 2