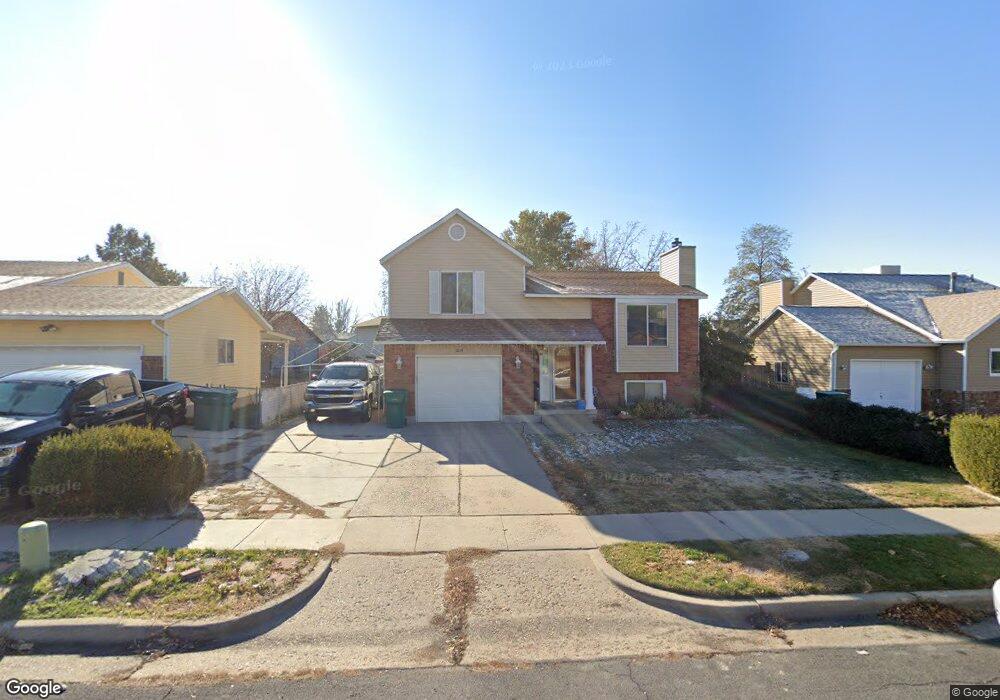
1054 W 2525 N Layton, UT 84041
Estimated Value: $436,000 - $464,000
4
Beds
2
Baths
1,784
Sq Ft
$251/Sq Ft
Est. Value
About This Home
This home is located at 1054 W 2525 N, Layton, UT 84041 and is currently estimated at $447,658, approximately $250 per square foot. 1054 W 2525 N is a home located in Davis County with nearby schools including Lincoln Elementary School, North Layton Junior High School, and Northridge High School.
Ownership History
Date
Name
Owned For
Owner Type
Purchase Details
Closed on
Aug 7, 2019
Sold by
Campbell Regina S and Regina S Campbell Trust
Bought by
Benavidez Francisco and Sandoval Guadalupe
Current Estimated Value
Home Financials for this Owner
Home Financials are based on the most recent Mortgage that was taken out on this home.
Original Mortgage
$272,964
Outstanding Balance
$240,281
Interest Rate
3.95%
Mortgage Type
FHA
Estimated Equity
$207,377
Purchase Details
Closed on
Jun 23, 2006
Sold by
Campbell Regina S
Bought by
Campbell Regina S and The Regina S Campbell Trust
Purchase Details
Closed on
Feb 20, 1998
Sold by
Campbell Regina S and Avery Regina S Campbell
Bought by
Campbell Regina S
Home Financials for this Owner
Home Financials are based on the most recent Mortgage that was taken out on this home.
Original Mortgage
$66,500
Interest Rate
6.9%
Create a Home Valuation Report for This Property
The Home Valuation Report is an in-depth analysis detailing your home's value as well as a comparison with similar homes in the area
Home Values in the Area
Average Home Value in this Area
Purchase History
| Date | Buyer | Sale Price | Title Company |
|---|---|---|---|
| Benavidez Francisco | -- | Pinnacle Title Ins Ag | |
| Campbell Regina S | -- | None Available | |
| Campbell Regina S | -- | Avis & Archibald Title |
Source: Public Records
Mortgage History
| Date | Status | Borrower | Loan Amount |
|---|---|---|---|
| Open | Benavidez Francisco | $272,964 | |
| Previous Owner | Campbell Regina S | $66,500 |
Source: Public Records
Tax History Compared to Growth
Tax History
| Year | Tax Paid | Tax Assessment Tax Assessment Total Assessment is a certain percentage of the fair market value that is determined by local assessors to be the total taxable value of land and additions on the property. | Land | Improvement |
|---|---|---|---|---|
| 2024 | $1,966 | $207,900 | $99,632 | $108,268 |
| 2023 | $2,060 | $384,000 | $127,651 | $256,349 |
| 2022 | $2,136 | $216,150 | $64,702 | $151,448 |
| 2021 | $1,934 | $292,000 | $83,812 | $208,188 |
| 2020 | $1,733 | $251,000 | $73,386 | $177,614 |
| 2019 | $1,593 | $226,000 | $72,413 | $153,587 |
| 2018 | $1,426 | $203,000 | $72,413 | $130,587 |
| 2016 | $1,262 | $92,730 | $21,250 | $71,480 |
| 2015 | $1,174 | $81,895 | $21,250 | $60,645 |
| 2014 | $1,219 | $86,924 | $21,250 | $65,674 |
| 2013 | -- | $84,561 | $20,680 | $63,881 |
Source: Public Records
Map
Nearby Homes
- 2402 N 725 W
- 2378 N 675 W
- 2887 N 1175 W
- 781 W 2150 N
- 2949 N 1175 W
- 850 S 1650 E Unit D
- 2211 N 525 W
- 709 W Highway 193
- 2248 N 500 W
- 1548 E 925 S
- 2875 N Hill Field Rd Unit 58
- 2875 N Hill Field Rd Unit 17
- 2875 N Hill Field Rd Unit 62
- 2187 N 450 W
- 65 Sunset Dr
- 63 Sunset Dr
- 1606 W 1960 N
- 86 Atherton Way
- 121 Barrington Way
- 1665 W 1960 N