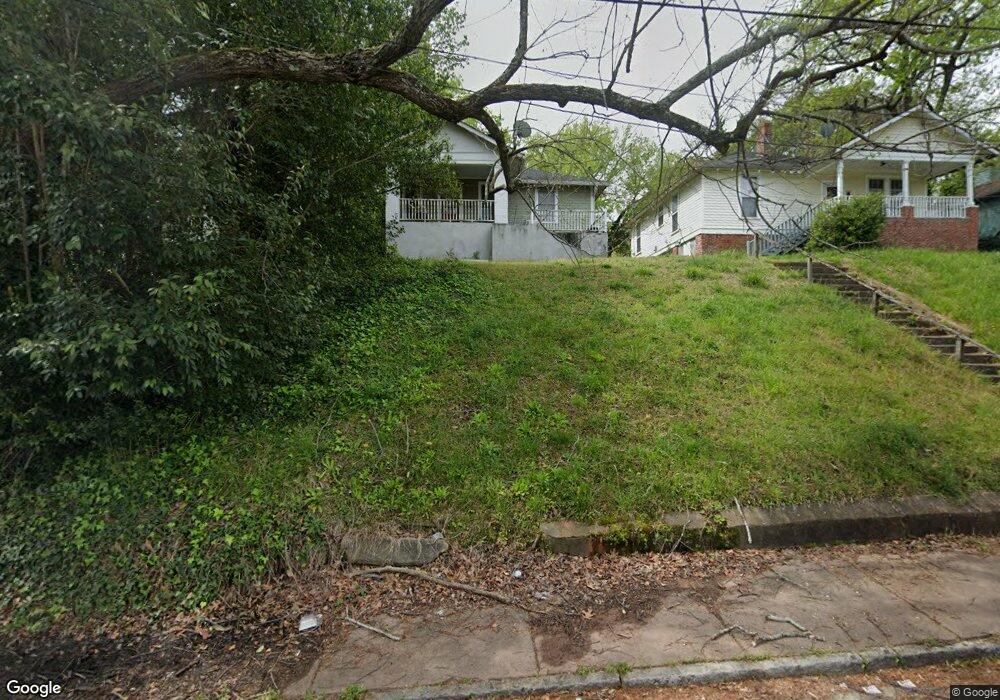
1054 Walnut St Macon, GA 31201
InTown NeighborhoodEstimated Value: $119,000 - $188,000
2
Beds
2
Baths
1,250
Sq Ft
$118/Sq Ft
Est. Value
About This Home
This home is located at 1054 Walnut St, Macon, GA 31201 and is currently estimated at $147,292, approximately $117 per square foot. 1054 Walnut St is a home with nearby schools including Williams Elementary School, Miller Fine Arts Magnet Middle School, and Central High School.
Ownership History
Date
Name
Owned For
Owner Type
Purchase Details
Closed on
Jun 13, 2008
Sold by
Carpenter Shawn O and Carpenter Bernard D
Bought by
Carpenter Jacob D
Current Estimated Value
Home Financials for this Owner
Home Financials are based on the most recent Mortgage that was taken out on this home.
Original Mortgage
$76,401
Outstanding Balance
$48,612
Interest Rate
5.97%
Mortgage Type
FHA
Estimated Equity
$98,680
Purchase Details
Closed on
Jul 24, 2000
Create a Home Valuation Report for This Property
The Home Valuation Report is an in-depth analysis detailing your home's value as well as a comparison with similar homes in the area
Home Values in the Area
Average Home Value in this Area
Purchase History
| Date | Buyer | Sale Price | Title Company |
|---|---|---|---|
| Carpenter Jacob D | $77,600 | None Available | |
| -- | $63,500 | -- |
Source: Public Records
Mortgage History
| Date | Status | Borrower | Loan Amount |
|---|---|---|---|
| Open | Carpenter Jacob D | $76,401 |
Source: Public Records
Tax History Compared to Growth
Tax History
| Year | Tax Paid | Tax Assessment Tax Assessment Total Assessment is a certain percentage of the fair market value that is determined by local assessors to be the total taxable value of land and additions on the property. | Land | Improvement |
|---|---|---|---|---|
| 2025 | $1,079 | $43,892 | $7,200 | $36,692 |
| 2024 | $1,115 | $43,892 | $7,200 | $36,692 |
| 2023 | $1,076 | $36,336 | $5,760 | $30,576 |
| 2022 | $1,134 | $32,766 | $5,878 | $26,888 |
| 2021 | $1,097 | $28,870 | $5,343 | $23,527 |
| 2020 | $1,121 | $28,870 | $5,343 | $23,527 |
| 2019 | $1,086 | $27,749 | $5,343 | $22,406 |
| 2018 | $1,844 | $27,749 | $5,343 | $22,406 |
| 2017 | $1,040 | $27,749 | $5,343 | $22,406 |
| 2016 | $960 | $27,750 | $5,343 | $22,406 |
| 2015 | $1,359 | $27,750 | $5,343 | $22,406 |
| 2014 | $521 | $27,750 | $5,343 | $22,406 |
Source: Public Records
Map
Nearby Homes