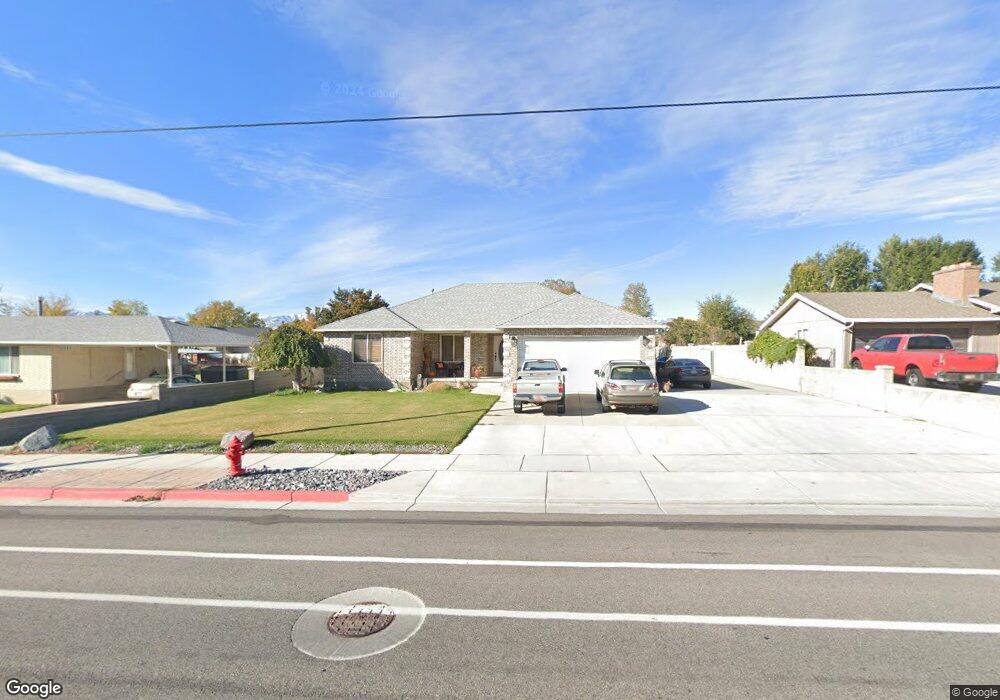
10540 S 2200 W South Jordan, UT 84095
Estimated Value: $741,000 - $799,387
5
Beds
3
Baths
3,408
Sq Ft
$227/Sq Ft
Est. Value
About This Home
This home is located at 10540 S 2200 W, South Jordan, UT 84095 and is currently estimated at $773,347, approximately $226 per square foot. 10540 S 2200 W is a home located in Salt Lake County with nearby schools including Monte Vista Elementary School, South Jordan Middle School, and Hawthorn Academy.
Ownership History
Date
Name
Owned For
Owner Type
Purchase Details
Closed on
Nov 16, 2009
Sold by
Almond Mark S
Bought by
Almond Mark S
Current Estimated Value
Home Financials for this Owner
Home Financials are based on the most recent Mortgage that was taken out on this home.
Original Mortgage
$197,100
Outstanding Balance
$128,171
Interest Rate
4.92%
Mortgage Type
New Conventional
Estimated Equity
$645,176
Purchase Details
Closed on
Feb 23, 1998
Sold by
Almond Mark
Bought by
South Jordan City
Create a Home Valuation Report for This Property
The Home Valuation Report is an in-depth analysis detailing your home's value as well as a comparison with similar homes in the area
Home Values in the Area
Average Home Value in this Area
Purchase History
| Date | Buyer | Sale Price | Title Company |
|---|---|---|---|
| Almond Mark S | -- | Surety Title | |
| South Jordan City | -- | -- |
Source: Public Records
Mortgage History
| Date | Status | Borrower | Loan Amount |
|---|---|---|---|
| Open | Almond Mark S | $197,100 |
Source: Public Records
Tax History Compared to Growth
Tax History
| Year | Tax Paid | Tax Assessment Tax Assessment Total Assessment is a certain percentage of the fair market value that is determined by local assessors to be the total taxable value of land and additions on the property. | Land | Improvement |
|---|---|---|---|---|
| 2025 | $3,915 | $753,000 | $222,800 | $530,200 |
| 2024 | $3,915 | $727,900 | $216,400 | $511,500 |
| 2023 | $3,900 | $698,600 | $214,300 | $484,300 |
| 2022 | $4,076 | $715,700 | $210,100 | $505,600 |
| 2021 | $3,302 | $532,000 | $161,600 | $370,400 |
| 2020 | $3,233 | $488,200 | $161,600 | $326,600 |
| 2019 | $3,212 | $476,700 | $126,000 | $350,700 |
| 2018 | $3,037 | $448,500 | $126,000 | $322,500 |
| 2017 | $2,937 | $425,100 | $126,000 | $299,100 |
| 2016 | $3,017 | $397,600 | $132,700 | $264,900 |
| 2015 | $2,785 | $361,100 | $142,200 | $218,900 |
| 2014 | $2,728 | $339,600 | $135,000 | $204,600 |
Source: Public Records
Map
Nearby Homes
- 10543 S 2330 W
- 2167 W Amber Blossom Way
- 6977 W Hidden Way S Unit 147
- 10366 S 2200 W
- 10804 S Haven Landing Dr
- 10838 S Haven Landing Dr
- 2343 Temple View Cir
- 10749 S 2200 W
- 481 W Haven Hill Way S Unit 9
- 1097 W Kings Landing Ct Unit 1
- 11302 S Haven Willow Way W
- 11316 S Haven Willow Way W Unit 5
- 1096 W Kings Landing Ct Unit 2
- 9584 S Ember Glow Ct W Unit D
- 1085 W Kings Landing Ct S Unit 6
- 9566 S Ember Glow Ct Unit D
- 9553 S Ember Glow Ct Unit D
- 524 W Haven Hill Way S Unit 3
- 9584 S Ember Glow Ct Unit C
- 9822 S South Temple Dr W
- 10540 S 2200 W
- 10562 S 2200 W
- 10562 S 2200 W
- 10524 S 2200 W
- 10566 S 2200 W
- 10535 S 2275 W
- 10516 S 2200 W
- 10555 S 2275 W
- 10517 S 2275 W
- 2182 Meridies Dr
- 10570 S 2200 W
- 10515 S 2200 W
- 2181 W Meridies Dr
- 10500 S 2200 W
- 10573 S 2275 W
- 10501 S 2275 W
- 2164 Meridies Dr
- 2164 W Meridies Dr
- 10544 S 2275 W
- 2169 Meridies Dr