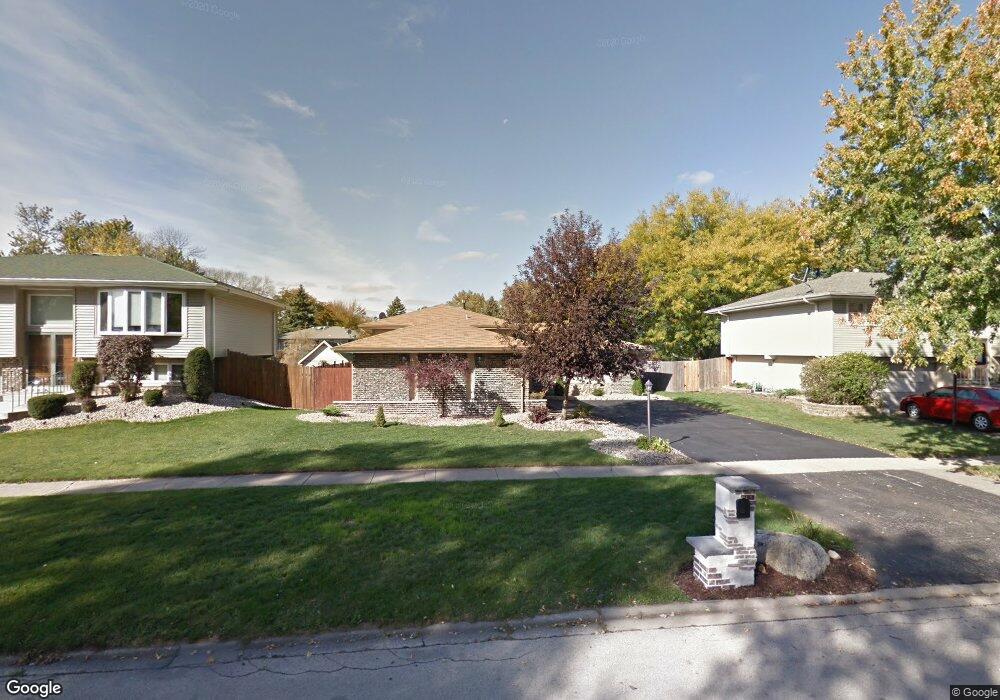
10542 S 84th Ave Unit 4 Palos Hills, IL 60465
Estimated Value: $332,000 - $378,993
3
Beds
2
Baths
1,372
Sq Ft
$267/Sq Ft
Est. Value
About This Home
This home is located at 10542 S 84th Ave Unit 4, Palos Hills, IL 60465 and is currently estimated at $366,248, approximately $266 per square foot. 10542 S 84th Ave Unit 4 is a home located in Cook County with nearby schools including Sorrick Elementary School, Oak Ridge Elementary School, and H H Conrady Jr High School.
Ownership History
Date
Name
Owned For
Owner Type
Purchase Details
Closed on
Mar 24, 2025
Sold by
Haberny Krzysztof S and Haberny Anna A
Bought by
Haberny Krzysztof S and Haberny Anna A
Current Estimated Value
Purchase Details
Closed on
Dec 17, 2010
Sold by
Us Bank National Association
Bought by
Haberny Krzysztof S and Haberny Anna A
Home Financials for this Owner
Home Financials are based on the most recent Mortgage that was taken out on this home.
Original Mortgage
$130,080
Interest Rate
4.65%
Mortgage Type
New Conventional
Purchase Details
Closed on
Oct 14, 2010
Sold by
Hernandez Ray
Bought by
Us Bank National Association
Purchase Details
Closed on
Aug 1, 2002
Sold by
Weber Joann
Bought by
Hernandez Ray and Hernandez Christi
Home Financials for this Owner
Home Financials are based on the most recent Mortgage that was taken out on this home.
Original Mortgage
$120,000
Interest Rate
6.62%
Create a Home Valuation Report for This Property
The Home Valuation Report is an in-depth analysis detailing your home's value as well as a comparison with similar homes in the area
Home Values in the Area
Average Home Value in this Area
Purchase History
| Date | Buyer | Sale Price | Title Company |
|---|---|---|---|
| Haberny Krzysztof S | -- | None Listed On Document | |
| Haberny Krzysztof S | $163,000 | 1St American Title | |
| Us Bank National Association | -- | None Available | |
| Hernandez Ray | $150,000 | Chicago Title Insurance Co |
Source: Public Records
Mortgage History
| Date | Status | Borrower | Loan Amount |
|---|---|---|---|
| Previous Owner | Haberny Krzysztof S | $130,080 | |
| Previous Owner | Hernandez Ray | $120,000 |
Source: Public Records
Tax History Compared to Growth
Tax History
| Year | Tax Paid | Tax Assessment Tax Assessment Total Assessment is a certain percentage of the fair market value that is determined by local assessors to be the total taxable value of land and additions on the property. | Land | Improvement |
|---|---|---|---|---|
| 2024 | $7,405 | $28,941 | $6,221 | $22,720 |
| 2023 | $6,671 | $28,941 | $6,221 | $22,720 |
| 2022 | $6,671 | $21,704 | $5,363 | $16,341 |
| 2021 | $6,497 | $21,703 | $5,362 | $16,341 |
| 2020 | $7,226 | $23,977 | $5,362 | $18,615 |
| 2019 | $6,516 | $22,330 | $4,933 | $17,397 |
| 2018 | $6,271 | $22,330 | $4,933 | $17,397 |
| 2017 | $6,897 | $24,924 | $4,933 | $19,991 |
| 2016 | $5,359 | $18,010 | $4,290 | $13,720 |
| 2015 | $5,965 | $20,137 | $4,290 | $15,847 |
| 2014 | $5,877 | $20,137 | $4,290 | $15,847 |
| 2013 | $5,250 | $19,382 | $4,290 | $15,092 |
Source: Public Records
Map
Nearby Homes
- 10562 S 84th Ave
- 10427 S Alta Dr
- 10441 S 83rd Ave
- 10408 S Alta Dr
- 10630 S Green Valley Dr
- 10230 S 83rd Ct
- 10221 S Eleanor Ave
- 10324 S 81st Ave
- 8556 W 102nd Terrace Unit 5315
- 10845 S 84th Ave Unit 2A
- 10845 S 84th Ave Unit 2B
- 11001 Stony Creek Dr Unit 2C
- 10820 Kathleen Ct Unit D
- 3 Stony Creek Dr Unit A
- 10531 S Roberts Rd Unit 2D
- 10226 S 81st Ave
- 10125 S 81st Ct
- 10927 Circle Dr
- 6 W Pebble Ct Unit A
- 11015 S 84th Ave Unit 3C
- 10534 S 84th Ave
- 10548 S 84th Ave
- 10554 S 84th Ave
- 10528 S 84th Ave Unit 4
- 10601 Chamonieux Dr
- 6220 N Springfield Ave
- 8585 W 103 Terrace Unit 305
- 9988 S 84th Terrace Terrace Unit 113
- 8409 103 Terrace Unit 307
- 10603 Chamonieux Dr
- 10543 S 84th Ave
- 10543 S 84th Ave
- 10545 S 84th Ave
- 10541 S 84th Ave
- 10541 S 84th Ave
- 10535 S 84th Ave
- 8436 Loveland Ln
- 10605 Chamonieux Dr
- 10602 S 84th Ave
- 10525 S 84th Ave