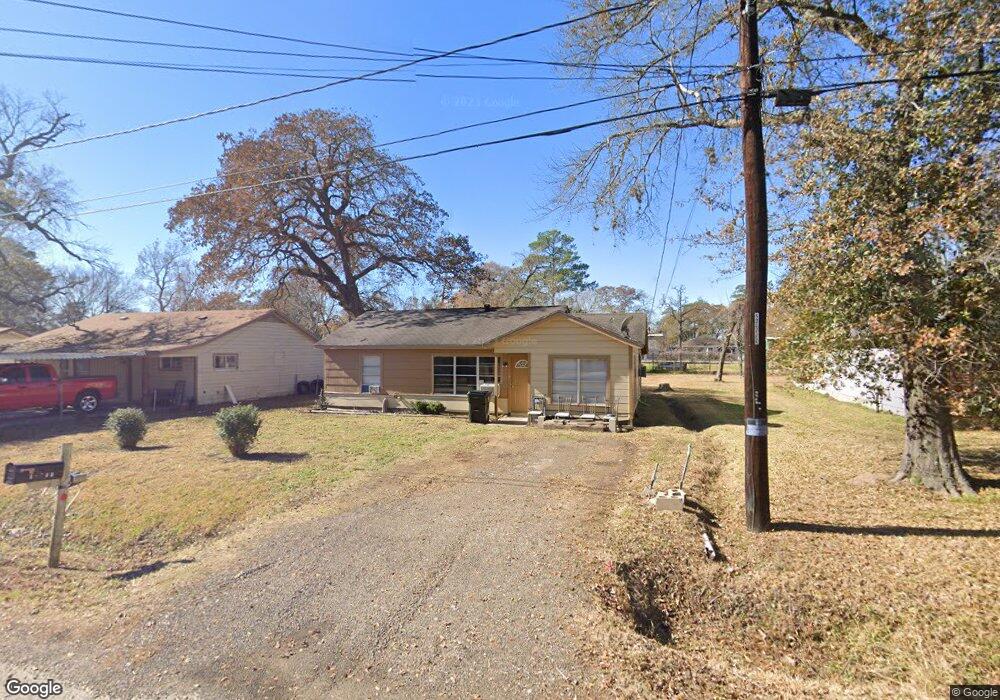
10545 Barnham St Houston, TX 77016
East Little York NeighborhoodEstimated Value: $130,000 - $221,000
3
Beds
1
Bath
1,044
Sq Ft
$152/Sq Ft
Est. Value
About This Home
This home is located at 10545 Barnham St, Houston, TX 77016 and is currently estimated at $158,552, approximately $151 per square foot. 10545 Barnham St is a home located in Harris County with nearby schools including Shadydale Elementary School, Forest Brook Middle, and North Forest High School.
Ownership History
Date
Name
Owned For
Owner Type
Purchase Details
Closed on
May 28, 2016
Sold by
Anderson Goldie Faye
Bought by
Anderson Renzell
Current Estimated Value
Purchase Details
Closed on
Dec 7, 2010
Sold by
Anderson Renzell and Anderson Goldie Faye
Bought by
Anderson Keanon Rolan
Purchase Details
Closed on
May 20, 2009
Sold by
Cox Coleman Jamar and Gillroy Anthony Wayne
Bought by
Gillroy Anthony
Purchase Details
Closed on
Dec 24, 2008
Sold by
Blue River Homes
Bought by
Gillroy Anthony
Purchase Details
Closed on
Feb 21, 2008
Sold by
Bhagia Sarojini
Bought by
Anderson Renzell and Anderson Goldie Faye
Home Financials for this Owner
Home Financials are based on the most recent Mortgage that was taken out on this home.
Original Mortgage
$33,250
Interest Rate
5.68%
Mortgage Type
Purchase Money Mortgage
Purchase Details
Closed on
Aug 7, 2006
Sold by
Bhagia Sarojini
Bought by
Blue River Homes
Purchase Details
Closed on
Oct 18, 2004
Sold by
N K Resources Inc
Bought by
Bhagia Sarojini
Purchase Details
Closed on
Apr 26, 2004
Sold by
Mar Robert L
Bought by
N K Resources Inc
Create a Home Valuation Report for This Property
The Home Valuation Report is an in-depth analysis detailing your home's value as well as a comparison with similar homes in the area
Home Values in the Area
Average Home Value in this Area
Purchase History
| Date | Buyer | Sale Price | Title Company |
|---|---|---|---|
| Anderson Renzell | -- | None Available | |
| Anderson Keanon Rolan | -- | None Available | |
| Gillroy Anthony | -- | None Available | |
| Gillroy Anthony | -- | None Available | |
| Anderson Renzell | -- | Fidelity National Title | |
| Blue River Homes | -- | None Available | |
| Bhagia Sarojini | -- | -- | |
| N K Resources Inc | -- | -- |
Source: Public Records
Mortgage History
| Date | Status | Borrower | Loan Amount |
|---|---|---|---|
| Previous Owner | Anderson Renzell | $33,250 |
Source: Public Records
Tax History Compared to Growth
Tax History
| Year | Tax Paid | Tax Assessment Tax Assessment Total Assessment is a certain percentage of the fair market value that is determined by local assessors to be the total taxable value of land and additions on the property. | Land | Improvement |
|---|---|---|---|---|
| 2025 | $2,456 | $117,398 | $61,013 | $56,385 |
| 2024 | $2,456 | $117,398 | $61,013 | $56,385 |
| 2023 | $2,456 | $107,051 | $37,685 | $69,366 |
| 2022 | $1,859 | $84,440 | $25,123 | $59,317 |
| 2021 | $1,784 | $76,561 | $25,123 | $51,438 |
| 2020 | $1,648 | $68,042 | $19,381 | $48,661 |
| 2019 | $1,648 | $65,127 | $12,920 | $52,207 |
| 2018 | $1,160 | $45,837 | $12,920 | $32,917 |
| 2017 | $1,159 | $45,837 | $12,920 | $32,917 |
| 2016 | $1,114 | $44,060 | $12,920 | $31,140 |
| 2015 | $945 | $36,755 | $12,920 | $23,835 |
| 2014 | $945 | $36,755 | $12,920 | $23,835 |
Source: Public Records
Map
Nearby Homes
- 5618 Briarwick Ln
- 10606 Bucknell Rd
- 5123 Francine Ln
- 5130 Farb Dr
- 10627 Castleton St
- 5022 Bretshire Dr
- 5611 Yorkwood St
- 5905 Langley Rd
- 5413 Glen Nook Dr
- 10434 Envoy St
- 4809 Edgewater Dr
- 10535 Hollyglen Dr
- 10526 Hollyglen Dr
- 5621 Haywood St
- 10538 Royal Oaks Dr
- 10430 Royal Oaks Dr
- 10221 Bretton Dr
- 6001 Bretshire Dr
- 0 Haywood St Unit 63273227
- 5418 Parker Rd
- 10541 Barnham St
- 10549 Barnham St
- 10537 Barnham St
- 10533 Barnham St
- 10548 Barnham St
- 10546 Barnham St
- 10542 Barnham St
- 10550 Barnham St
- 10534 Caxton St
- 10538 Barnham St
- 10529 Barnham St
- 10530 Caxton St
- 10545 Caxton St
- 10541 Caxton St
- 10525 Barnham St
- 10549 Caxton St
- 10530 Barnham St
- 10551 Bainbridge St
- 10539 Bainbridge St
- 10526 Caxton St