Estimated Value: $189,874 - $216,000
--
Bed
2
Baths
1,430
Sq Ft
$142/Sq Ft
Est. Value
About This Home
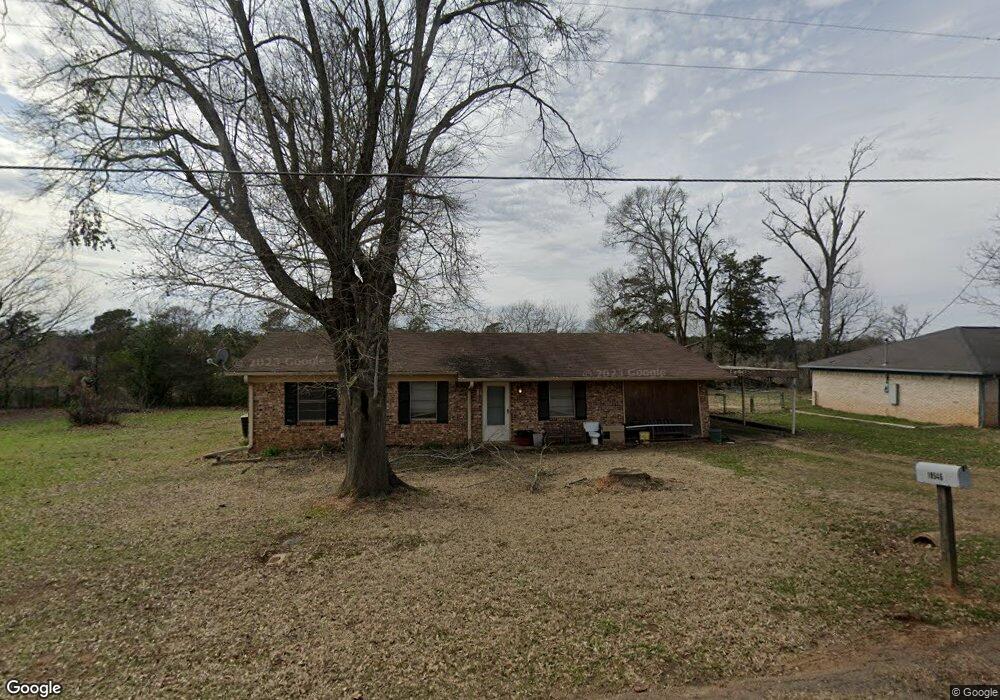
This home is located at 10546 Creek Bend Dr, Tyler, TX 75707 and is currently estimated at $203,469, approximately $142 per square foot. 10546 Creek Bend Dr is a home located in Smith County with nearby schools including Kissam Intermediate School, Jackson Elementary School, and Chapel Hill Middle School.
Ownership History
Date
Name
Owned For
Owner Type
Purchase Details
Closed on
Nov 3, 2010
Sold by
The Secretary Of Housing & Urban Develop
Bought by
Moncrief Kristal and Moncrief James D
Current Estimated Value
Home Financials for this Owner
Home Financials are based on the most recent Mortgage that was taken out on this home.
Original Mortgage
$51,022
Outstanding Balance
$33,365
Interest Rate
4.25%
Mortgage Type
FHA
Estimated Equity
$170,104
Purchase Details
Closed on
Feb 28, 2008
Sold by
Boynton Denise G and Boynton Barry
Bought by
Sustaire Luke C
Home Financials for this Owner
Home Financials are based on the most recent Mortgage that was taken out on this home.
Original Mortgage
$87,778
Interest Rate
5.68%
Mortgage Type
Purchase Money Mortgage
Create a Home Valuation Report for This Property
The Home Valuation Report is an in-depth analysis detailing your home's value as well as a comparison with similar homes in the area
Home Values in the Area
Average Home Value in this Area
Purchase History
| Date | Buyer | Sale Price | Title Company |
|---|---|---|---|
| Moncrief Kristal | -- | None Available | |
| Sustaire Luke C | -- | None Available |
Source: Public Records
Mortgage History
| Date | Status | Borrower | Loan Amount |
|---|---|---|---|
| Open | Moncrief Kristal | $51,022 | |
| Previous Owner | Sustaire Luke C | $87,778 |
Source: Public Records
Tax History Compared to Growth
Tax History
| Year | Tax Paid | Tax Assessment Tax Assessment Total Assessment is a certain percentage of the fair market value that is determined by local assessors to be the total taxable value of land and additions on the property. | Land | Improvement |
|---|---|---|---|---|
| 2025 | $1,803 | $148,360 | $14,264 | $134,096 |
| 2024 | $1,803 | $136,400 | $28,125 | $135,809 |
| 2023 | $2,118 | $157,582 | $28,125 | $129,457 |
| 2022 | $1,802 | $133,570 | $12,500 | $121,070 |
| 2021 | $1,746 | $102,479 | $12,500 | $89,979 |
| 2020 | $1,748 | $98,434 | $12,500 | $85,934 |
| 2019 | $1,752 | $94,625 | $12,500 | $82,125 |
| 2018 | $1,648 | $89,344 | $12,500 | $76,844 |
| 2017 | $1,749 | $94,323 | $12,500 | $81,823 |
| 2016 | $1,743 | $93,995 | $12,500 | $81,495 |
| 2015 | $1,509 | $90,148 | $12,500 | $77,648 |
| 2014 | $1,509 | $86,175 | $12,500 | $73,675 |
Source: Public Records
Map
Nearby Homes
- 10680 County Road 214
- 10789 County Road 214
- 9961 Creek Bend Dr
- 13310 White Tail Dr
- 13311 White Tail Dr
- 13311 White Tail Dr Unit 1
- 13332 White Tail Dr
- 7789 Lakeshore Dr
- 11452 County Road 2326
- 13807 County Road 220
- 13800 County Road 220
- 13594 State Highway 64 E
- 00 County Road 2209
- 10788 County Road 225
- 10908 & 10914 County Road 225
- 8217 County Road 219
- 8226 County Road 219
- 0000 State Highway 64
- 3515 Chapel View
- 3507 Chapel View
- 10524 Creek Bend Dr
- 10582 Creek Bend Dr
- 10537 Creek Bend Dr
- 10506 Creek Bend Dr
- 10567 Creek Bend Dr
- 10509 Creek Bend Dr
- 10600 Creek Bend Dr
- 10488 Creek Bend Dr
- 10599 Creek Bend Dr
- 10515 Parkwood Dr
- 10489 Creek Bend Dr
- 10521 Wildwood Dr
- 10477 Creek Bend Dr
- 10470 Creek Bend Dr
- 10668 Morris Rd
- 10537 Parkwood Dr
- 10668 Creek Bend Dr
- 10613 Creek Bend Dr
- 10662 County Road 214
- 10530 Parkwood Dr