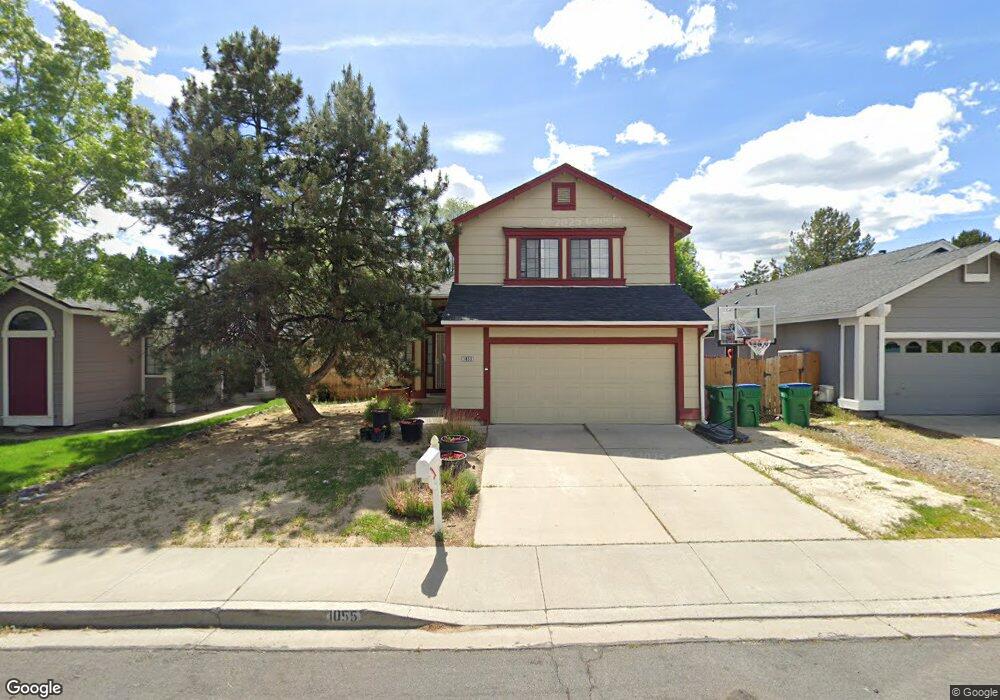
1055 Backer Way Reno, NV 89523
Mae Anne Avenue NeighborhoodEstimated Value: $512,231 - $542,000
3
Beds
3
Baths
1,384
Sq Ft
$382/Sq Ft
Est. Value
About This Home
This home is located at 1055 Backer Way, Reno, NV 89523 and is currently estimated at $528,308, approximately $381 per square foot. 1055 Backer Way is a home located in Washoe County with nearby schools including Sarah Winnemucca Elementary School, B D Billinghurst Middle School, and Robert McQueen High School.
Ownership History
Date
Name
Owned For
Owner Type
Purchase Details
Closed on
Dec 26, 2012
Sold by
Lloyd Walter P and Lloyd Jessica G
Bought by
Lloyd Jessica G
Current Estimated Value
Purchase Details
Closed on
Oct 20, 2005
Sold by
Lloyd Yolanda
Bought by
Lloyd Walter P
Home Financials for this Owner
Home Financials are based on the most recent Mortgage that was taken out on this home.
Original Mortgage
$269,925
Outstanding Balance
$145,476
Interest Rate
5.87%
Mortgage Type
Unknown
Estimated Equity
$382,832
Purchase Details
Closed on
Jun 11, 2003
Sold by
Kennedy John Eugene and Kennedy Kim Marie
Bought by
Wildeman Vincent E and Robinson Melanie A
Home Financials for this Owner
Home Financials are based on the most recent Mortgage that was taken out on this home.
Original Mortgage
$215,000
Interest Rate
5.61%
Mortgage Type
Unknown
Create a Home Valuation Report for This Property
The Home Valuation Report is an in-depth analysis detailing your home's value as well as a comparison with similar homes in the area
Home Values in the Area
Average Home Value in this Area
Purchase History
| Date | Buyer | Sale Price | Title Company |
|---|---|---|---|
| Lloyd Jessica G | -- | First American Title Paseo V | |
| Lloyd Walter P | -- | Ticor Title Of Nevada Inc | |
| Lloyd Walter P | $360,000 | Ticor Title Of Nevada Inc | |
| Wildeman Vincent E | $215,000 | Western Title Incorporated |
Source: Public Records
Mortgage History
| Date | Status | Borrower | Loan Amount |
|---|---|---|---|
| Open | Lloyd Walter P | $269,925 | |
| Previous Owner | Wildeman Vincent E | $215,000 |
Source: Public Records
Tax History Compared to Growth
Tax History
| Year | Tax Paid | Tax Assessment Tax Assessment Total Assessment is a certain percentage of the fair market value that is determined by local assessors to be the total taxable value of land and additions on the property. | Land | Improvement |
|---|---|---|---|---|
| 2025 | $2,526 | $81,845 | $39,340 | $42,505 |
| 2024 | $2,526 | $78,764 | $35,595 | $43,169 |
| 2023 | $2,339 | $78,700 | $37,520 | $41,180 |
| 2022 | $2,168 | $66,183 | $31,605 | $34,578 |
| 2021 | $2,009 | $56,397 | $21,735 | $34,662 |
| 2020 | $1,887 | $55,861 | $20,895 | $34,966 |
| 2019 | $1,797 | $54,886 | $20,755 | $34,131 |
| 2018 | $1,713 | $48,672 | $15,085 | $33,587 |
| 2017 | $1,645 | $47,895 | $14,070 | $33,825 |
| 2016 | $1,604 | $47,384 | $12,670 | $34,714 |
| 2015 | $1,600 | $45,980 | $11,095 | $34,885 |
| 2014 | $1,550 | $44,113 | $9,975 | $34,138 |
| 2013 | -- | $41,019 | $7,245 | $33,774 |
Source: Public Records
Map
Nearby Homes
- 1255 Silver Crest Cir
- 6087 White Water Way
- 1500 Backer Way
- 5870 Blue Horizon Dr
- 5830 Blue Horizon Dr
- 1031 Ambassador Dr
- 5895 Blue Horizon Dr
- 6357 Moon Ridge Terrace
- 6339 Park Place
- 6338 Chesterfield Ln
- 1659 Shadow Park Dr
- 5878 Grand Row Way
- 5882 Grand Row Way Unit Lot 61
- 0 Simons Dr
- 1627 Prancer St Unit Lot 50
- 1627 Prancer St
- 1615 Prancer St Unit Lot 53
- 1689 Shadow Park Dr
- Walker Plan at Monarch
- Humboldt Plan at Monarch
- 1065 Backer Way
- 1045 Backer Way
- 5836 Starcrest Ave
- 1035 Backer Way
- 5837 Walnut Creek Rd
- 5840 Starcrest Ave Unit 2
- 1060 Backer Way
- 1070 Backer Way
- 5843 Walnut Creek Rd
- 1080 Backer Way
- 1050 Backer Way
- 1095 Backer Way
- 5848 Starcrest Ave
- 5848 Starcrest Ave Unit 270
- 5848 Starcrest Ave
- 1090 Backer Way
- 1040 Backer Way
- 5849 Walnut Creek Rd
- 1015 Backer Way
- 1030 Backer Way