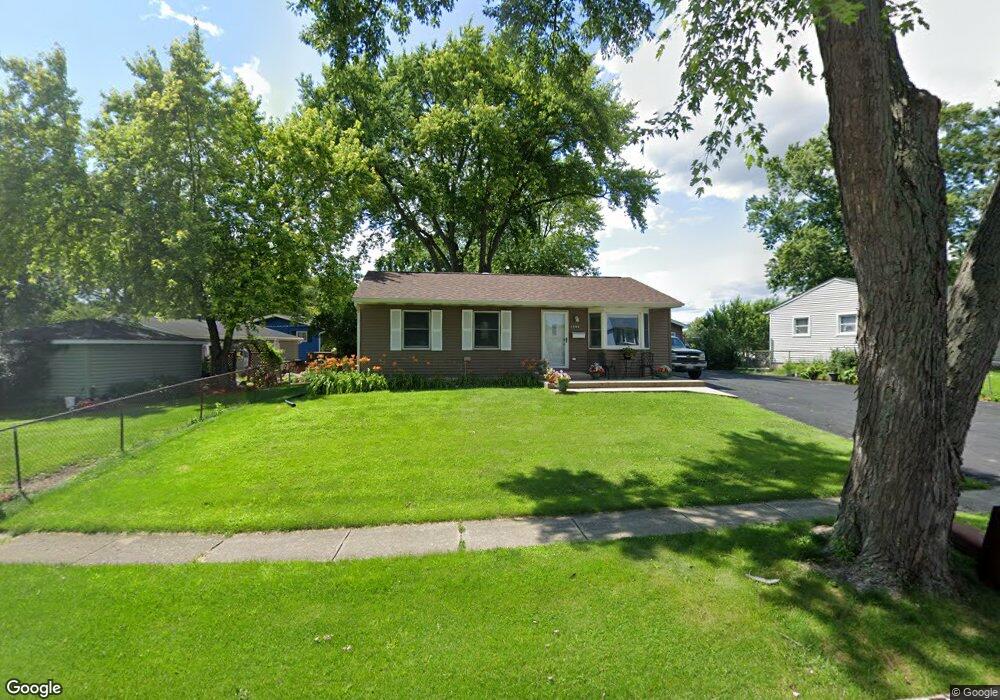
1055 Larkdale Row Wauconda, IL 60084
Estimated Value: $263,109 - $338,000
--
Bed
2
Baths
921
Sq Ft
$313/Sq Ft
Est. Value
About This Home
This home is located at 1055 Larkdale Row, Wauconda, IL 60084 and is currently estimated at $288,027, approximately $312 per square foot. 1055 Larkdale Row is a home located in Lake County with nearby schools including Robert Crown School, Wauconda Middle School, and Wauconda High School.
Ownership History
Date
Name
Owned For
Owner Type
Purchase Details
Closed on
Nov 21, 2011
Sold by
Bender Lisa L and Gilchrist Lisa L
Bought by
Gilchrist Lisa L
Current Estimated Value
Home Financials for this Owner
Home Financials are based on the most recent Mortgage that was taken out on this home.
Original Mortgage
$159,282
Outstanding Balance
$111,100
Interest Rate
4.5%
Mortgage Type
FHA
Estimated Equity
$176,927
Purchase Details
Closed on
Dec 21, 2009
Sold by
Bender Matthew K and Bender Lisa L
Bought by
Bender Lisa L
Purchase Details
Closed on
Dec 29, 2003
Sold by
Forsythe Kevin N and Forsythe Karen M
Bought by
Bender Matthew K and Bender Lisa L
Home Financials for this Owner
Home Financials are based on the most recent Mortgage that was taken out on this home.
Original Mortgage
$177,493
Interest Rate
6.08%
Mortgage Type
FHA
Create a Home Valuation Report for This Property
The Home Valuation Report is an in-depth analysis detailing your home's value as well as a comparison with similar homes in the area
Home Values in the Area
Average Home Value in this Area
Purchase History
| Date | Buyer | Sale Price | Title Company |
|---|---|---|---|
| Gilchrist Lisa L | -- | First American Title | |
| Bender Lisa L | -- | None Available | |
| Bender Matthew K | $180,000 | Heritage Title Co |
Source: Public Records
Mortgage History
| Date | Status | Borrower | Loan Amount |
|---|---|---|---|
| Open | Gilchrist Lisa L | $159,282 | |
| Closed | Bender Matthew K | $177,493 |
Source: Public Records
Tax History Compared to Growth
Tax History
| Year | Tax Paid | Tax Assessment Tax Assessment Total Assessment is a certain percentage of the fair market value that is determined by local assessors to be the total taxable value of land and additions on the property. | Land | Improvement |
|---|---|---|---|---|
| 2024 | $4,958 | $70,347 | $14,515 | $55,832 |
| 2023 | $5,591 | $58,457 | $12,062 | $46,395 |
| 2022 | $5,591 | $57,241 | $14,694 | $42,547 |
| 2021 | $5,323 | $54,088 | $13,885 | $40,203 |
| 2020 | $5,140 | $51,552 | $13,234 | $38,318 |
| 2019 | $4,555 | $48,721 | $12,507 | $36,214 |
| 2018 | $4,005 | $40,850 | $13,183 | $27,667 |
| 2017 | $3,999 | $40,378 | $13,031 | $27,347 |
| 2016 | $3,736 | $38,237 | $12,340 | $25,897 |
| 2015 | $3,480 | $35,102 | $11,328 | $23,774 |
| 2014 | $3,362 | $36,021 | $8,235 | $27,786 |
| 2012 | $3,303 | $34,797 | $7,879 | $26,918 |
Source: Public Records
Map
Nearby Homes
- 26036 Illinois Route 59
- 532 Brown St
- 225 Larkdale Row
- 240 Regency Ct
- 235 Regency Ct Unit B
- 225 Regency Ct Unit A
- 26241 W Bonner Rd
- 136 Parkview Dr Unit 5136
- 335 Farmhill Cir
- 26049 N Il Route 59
- 28177 N Garland Rd
- 450 N Main St Unit S307A
- 450 N Main St Unit S208A
- 311 Brown St
- 651 W Liberty St Unit B
- 29295 N Callahan Rd
- 136 Hubbard Ct
- 28855 N Garland Rd
- 29564 N Garland Rd
- 131 E Mill St Unit B104
- 1075 Larkdale Row
- 643 Marine Dr
- 645 Marine Dr
- 1085 Larkdale Row
- 651 Marine Dr
- 1070 Larkdale Row
- 1060 Larkdale Row
- 1095 Larkdale Row
- 1040 Larkdale Row
- 1080 Larkdale Row
- 1050 Larkdale Row
- 653 Marine Dr
- 1090 Larkdale Row
- 640 Marine Dr
- 648 Marine Dr
- 1105 Larkdale Row
- 1043 Larkdale Row
- 1030 Larkdale Row
- 1100 Larkdale Row
- 655 Marine Dr