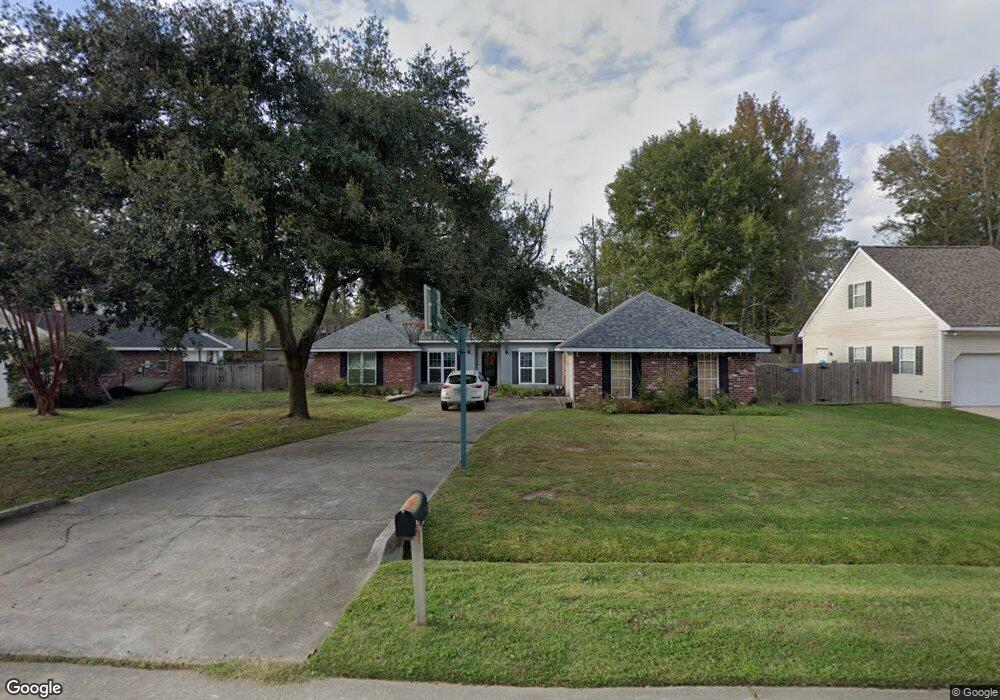
1055 Live Oak Loop None Mandeville, LA 70448
Estimated Value: $397,346 - $439,000
4
Beds
2
Baths
2,482
Sq Ft
$168/Sq Ft
Est. Value
About This Home
This home is located at 1055 Live Oak Loop None, Mandeville, LA 70448 and is currently estimated at $417,337, approximately $168 per square foot. 1055 Live Oak Loop None is a home located in St. Tammany Parish with nearby schools including Woodlake Elementary School, Mandeville Middle School, and Fontainebleau Junior High School.
Ownership History
Date
Name
Owned For
Owner Type
Purchase Details
Closed on
Jul 13, 2021
Sold by
Massa Veronica P and Massa Frank M
Bought by
Mcneil Monica Massa
Current Estimated Value
Purchase Details
Closed on
Oct 20, 2015
Sold by
Stone Financing Llc
Bought by
Massa Frank M and Massa Monica
Purchase Details
Closed on
Jul 21, 2015
Sold by
Brookfield Relocation Inc
Bought by
Stone Financing Llc
Purchase Details
Closed on
May 25, 2015
Sold by
Wiley Arthur and Wiley Lenita
Bought by
Brookfield Relocation Inc
Purchase Details
Closed on
Oct 19, 2009
Sold by
Harper David G and Harper Sandra Mahr
Bought by
Wiley Arthur and Wiley Lenita
Home Financials for this Owner
Home Financials are based on the most recent Mortgage that was taken out on this home.
Original Mortgage
$278,856
Interest Rate
5.05%
Mortgage Type
FHA
Create a Home Valuation Report for This Property
The Home Valuation Report is an in-depth analysis detailing your home's value as well as a comparison with similar homes in the area
Home Values in the Area
Average Home Value in this Area
Purchase History
| Date | Buyer | Sale Price | Title Company |
|---|---|---|---|
| Mcneil Monica Massa | -- | None Available | |
| Massa Frank M | $269,000 | -- | |
| Stone Financing Llc | $278,000 | -- | |
| Brookfield Relocation Inc | $278,000 | -- | |
| Wiley Arthur | $284,000 | Mahony Title & Land Services |
Source: Public Records
Mortgage History
| Date | Status | Borrower | Loan Amount |
|---|---|---|---|
| Previous Owner | Wiley Arthur | $278,856 |
Source: Public Records
Tax History
| Year | Tax Paid | Tax Assessment Tax Assessment Total Assessment is a certain percentage of the fair market value that is determined by local assessors to be the total taxable value of land and additions on the property. | Land | Improvement |
|---|---|---|---|---|
| 2025 | $2,975 | $32,304 | $4,500 | $27,804 |
| 2024 | $2,975 | $32,304 | $4,500 | $27,804 |
| 2023 | $3,085 | $28,668 | $4,500 | $24,168 |
| 2022 | $280,582 | $28,668 | $4,500 | $24,168 |
| 2021 | $2,801 | $28,668 | $4,500 | $24,168 |
| 2020 | $2,798 | $28,668 | $4,500 | $24,168 |
| 2019 | $3,584 | $26,141 | $4,500 | $21,641 |
| 2018 | $3,589 | $26,141 | $4,500 | $21,641 |
| 2017 | $3,622 | $26,141 | $4,500 | $21,641 |
| 2016 | $3,651 | $26,141 | $4,500 | $21,641 |
| 2015 | $2,557 | $25,318 | $4,500 | $20,818 |
| 2014 | $2,530 | $25,318 | $4,500 | $20,818 |
| 2013 | -- | $25,318 | $4,500 | $20,818 |
Source: Public Records
Map
Nearby Homes
- 39 Stonebridge Ct
- 108 Cornerstone Dr
- 337 Winchester Cir
- 215 Pineridge Ct
- 362 Winchester Cir
- 207 Pineridge Ct
- 17 Colony Trail Dr
- 170 Remington Dr
- 1 Jennifer Ct
- 307 Morningside Dr
- 2251 Labarre St
- 665 Plantation Blvd
- 209 Richland Dr E
- 663 Plantation Blvd
- 2320 Destin St
- 8092 Winners Cir
- 8095 Winners Cir
- 1055 Live Oak Loop
- 1053 Live Oak Loop
- 1053 Live Oak Loop Other
- 1057 Live Oak Loop
- 2011 Red Oak Ln
- 2013 Red Oak Ln
- 1051 Live Oak Loop
- 2009 Red Oak Ln
- 1056 Live Oak Loop
- 1051 Live Oak Loop Other
- 1058 Live Oak Loop Other
- 1059 Live Oak Loop
- 1054 Live Oak Loop
- 1058 Live Oak Loop
- 1052 Live Oak Ln
- 2015 Red Oak Ln
- 2007 Red Oak Ln
- 1052 Live Oak Loop
- 1052 Live Oak Other
- 1060 Live Oak Loop
Your Personal Tour Guide
Ask me questions while you tour the home.