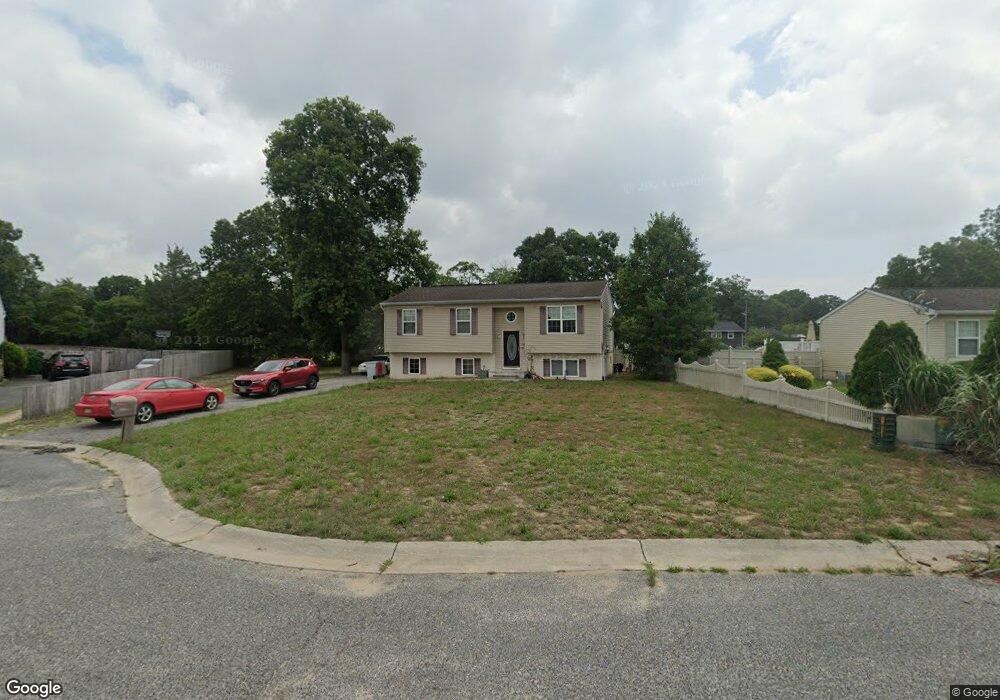
1055 Mars Place Vineland, NJ 08360
Estimated Value: $250,384 - $332,000
--
Bed
--
Bath
1,612
Sq Ft
$181/Sq Ft
Est. Value
About This Home
This home is located at 1055 Mars Place, Vineland, NJ 08360 and is currently estimated at $291,596, approximately $180 per square foot. 1055 Mars Place is a home located in Cumberland County with nearby schools including Marie D. Durand Elementary School, T.W. Wallace Middle School, and Vineland Senior High School.
Ownership History
Date
Name
Owned For
Owner Type
Purchase Details
Closed on
Sep 13, 2019
Sold by
Elliot Tracey L
Bought by
Mjm Development Llc
Current Estimated Value
Purchase Details
Closed on
Jan 30, 2004
Sold by
Antro Builders Inc
Bought by
Harden Lydia J
Home Financials for this Owner
Home Financials are based on the most recent Mortgage that was taken out on this home.
Original Mortgage
$84,510
Interest Rate
5.82%
Create a Home Valuation Report for This Property
The Home Valuation Report is an in-depth analysis detailing your home's value as well as a comparison with similar homes in the area
Home Values in the Area
Average Home Value in this Area
Purchase History
| Date | Buyer | Sale Price | Title Company |
|---|---|---|---|
| Mjm Development Llc | -- | -- | |
| Harden Lydia J | $93,900 | -- |
Source: Public Records
Mortgage History
| Date | Status | Borrower | Loan Amount |
|---|---|---|---|
| Previous Owner | Harden Lydia J | $84,510 |
Source: Public Records
Tax History Compared to Growth
Tax History
| Year | Tax Paid | Tax Assessment Tax Assessment Total Assessment is a certain percentage of the fair market value that is determined by local assessors to be the total taxable value of land and additions on the property. | Land | Improvement |
|---|---|---|---|---|
| 2025 | $3,767 | $118,300 | $24,200 | $109,900 |
| 2024 | $3,767 | $118,300 | $24,200 | $109,900 |
| 2023 | $3,742 | $118,300 | $0 | $0 |
| 2022 | $3,631 | $118,300 | $0 | $0 |
| 2021 | $3,564 | $118,300 | $0 | $0 |
| 2020 | $3,463 | $118,300 | $0 | $0 |
| 2019 | $3,415 | $134,100 | $24,200 | $109,900 |
| 2018 | $3,325 | $134,100 | $24,200 | $109,900 |
| 2017 | $3,159 | $134,100 | $24,200 | $109,900 |
| 2016 | $3,047 | $134,100 | $24,200 | $109,900 |
| 2015 | $2,935 | $134,100 | $24,200 | $109,900 |
| 2014 | $2,775 | $134,100 | $24,200 | $109,900 |
Source: Public Records
Map
Nearby Homes
- 1252 W Oak Rd
- 1230 Almond Rd
- 1489 N Delsea Dr
- 663 Wayne Ave
- 1811 N Delsea Dr Unit 4
- 1535 W Landis Ave
- 1799 W Landis Ave
- 1457 W Landis Ave
- 550 Northwest Ave
- 127 Doren Terrace
- 0 W Landis Ave
- 829 W Garden Rd
- 1887 N Delsea Dr Unit 135 HOLLY HOCK DR.
- 1887 N Delsea Dr Unit 19
- 1887 N Delsea Dr Unit 39
- 108 W Park Ave
- 225 Laurel St
- 811 W Garden Rd
- 317 Oxford St
- 2246 N West Ave
- 1035 Mars Place
- 1065 Mars Place
- 1048 Mercury Way
- 1066 Mercury Way
- 1030 Mercury Way
- 1070 Mars Place
- 1015 Mars Place
- 1054 Mars Place
- 1086 Mercury Way
- 1034 Mars Place
- 1064 Mars Place
- 1012 Mercury Way
- 1014 Mars Place
- 1631 W Oak Rd
- 1647 W Oak Rd
- 1047 Mercury Way
- 1065 Mercury Way
- 1660 Neptune Terrace
- 1674 Neptune Terrace
- 1029 Mercury Way