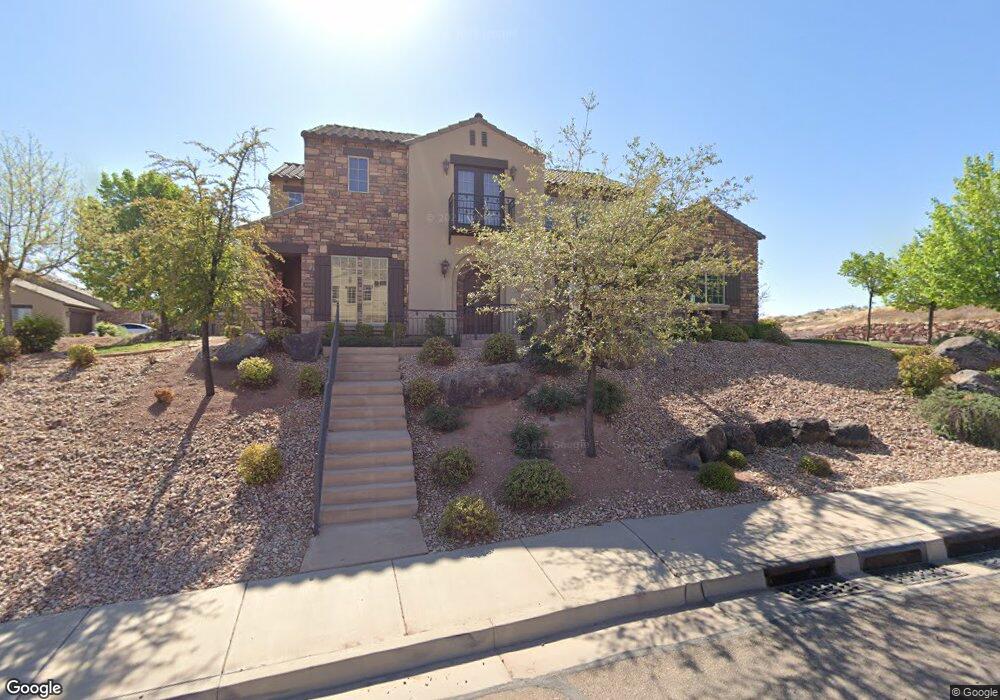
1055 Province Way Unit 106 Saint George, UT 84770
Estimated Value: $386,000 - $464,000
3
Beds
3
Baths
2,196
Sq Ft
$200/Sq Ft
Est. Value
About This Home
This home is located at 1055 Province Way Unit 106, Saint George, UT 84770 and is currently estimated at $439,253, approximately $200 per square foot. 1055 Province Way Unit 106 is a home located in Washington County with nearby schools including Arrowhead School, Dixie Intermediate School, and Dixie Middle School.
Ownership History
Date
Name
Owned For
Owner Type
Purchase Details
Closed on
Oct 29, 2021
Sold by
Haskell Homes Inc
Bought by
Tuscan Hills Owners Association
Current Estimated Value
Purchase Details
Closed on
Nov 20, 2019
Sold by
Wishert Rebecca Dee
Bought by
Wilbur Steven Ray and Wilbur Gloria Marilu
Home Financials for this Owner
Home Financials are based on the most recent Mortgage that was taken out on this home.
Original Mortgage
$259,920
Interest Rate
3.5%
Mortgage Type
New Conventional
Purchase Details
Closed on
Jun 27, 2017
Sold by
Purple Sage Rp Llc
Bought by
Wishert Rebecca Dae
Purchase Details
Closed on
Nov 17, 2010
Sold by
Smith Scott M and Smith Karen P
Bought by
Purple Sage Rp Llc
Purchase Details
Closed on
Apr 9, 2008
Sold by
Haskell Homes Inc
Bought by
Smith Scott M and Smith Karen P
Create a Home Valuation Report for This Property
The Home Valuation Report is an in-depth analysis detailing your home's value as well as a comparison with similar homes in the area
Home Values in the Area
Average Home Value in this Area
Purchase History
| Date | Buyer | Sale Price | Title Company |
|---|---|---|---|
| Tuscan Hills Owners Association | -- | None Available | |
| Wilbur Steven Ray | -- | Southern Utah Title Co | |
| Wishert Rebecca Dae | -- | Southern Utah Title | |
| Purple Sage Rp Llc | -- | None Available | |
| Smith Scott M | -- | Southern Utah Title Co |
Source: Public Records
Mortgage History
| Date | Status | Borrower | Loan Amount |
|---|---|---|---|
| Previous Owner | Wilbur Steven Ray | $259,920 |
Source: Public Records
Tax History Compared to Growth
Tax History
| Year | Tax Paid | Tax Assessment Tax Assessment Total Assessment is a certain percentage of the fair market value that is determined by local assessors to be the total taxable value of land and additions on the property. | Land | Improvement |
|---|---|---|---|---|
| 2025 | $1,688 | $255,915 | $52,250 | $203,665 |
| 2023 | $1,758 | $262,625 | $44,000 | $218,625 |
| 2022 | $1,669 | $234,520 | $27,500 | $207,020 |
| 2021 | $1,547 | $324,100 | $40,000 | $284,100 |
| 2020 | $1,411 | $278,500 | $40,000 | $238,500 |
| 2019 | $1,393 | $268,500 | $40,000 | $228,500 |
| 2018 | $1,393 | $138,655 | $0 | $0 |
| 2017 | $2,522 | $243,700 | $0 | $0 |
| 2016 | $2,586 | $231,100 | $0 | $0 |
| 2015 | $2,429 | $208,300 | $0 | $0 |
| 2014 | $2,393 | $206,500 | $0 | $0 |
Source: Public Records
Map
Nearby Homes
- 1060 W Province Way Unit 133
- 1060 W Province Way
- 1716 S 1310 W
- 1696 S 1380 W
- 1065 W Albertine Ln
- 0 Lava Pointe Dr Unit 25-260968
- 667 Lava Point Drive Lot #5 Dr
- 668 Lava Pointe Dr
- 667 Lava Pointe Dr Unit 5
- 667 Lava Pointe Dr
- 767 W Uxbridge Dr
- 639 W Uxbridge Dr
- 2261 S Tonaquint Dr Unit 31
- 2661 Tonaquint Dr
- 2661 Tonaquint Dr Unit 13
- 2169 S Legacy Dr
- 2440 S 1200 W
- 0 W Top Rope Cir
- 844 W Hampton Rd
- 853 W Hampton Rd
- 1055 Province Way Unit 112
- 1055 Province Way Unit 111
- 1055 Province Way Unit 110
- 1055 Province Way Unit 109
- 1055 Province Way Unit 108
- 1055 Province Way Unit 107
- 1055 Province Way Unit 105
- 1055 Province Way Unit 102
- 1055 Province Way Unit 101
- 1055 Province Way
- 1055 W Province Way Unit 112
- 1055 W Province Way Unit 120
- 1055 W Province Way Unit 119
- 1055 W Province Way Unit 118
- 1055 W Province Way Unit 109
- 1055 W Province Way Unit 101
- 1055 Province Way Unit 119
- 1055 W Province Way Unit 108
- 1055 W Province Way Unit 110
- 1055 W Province Way Unit 105