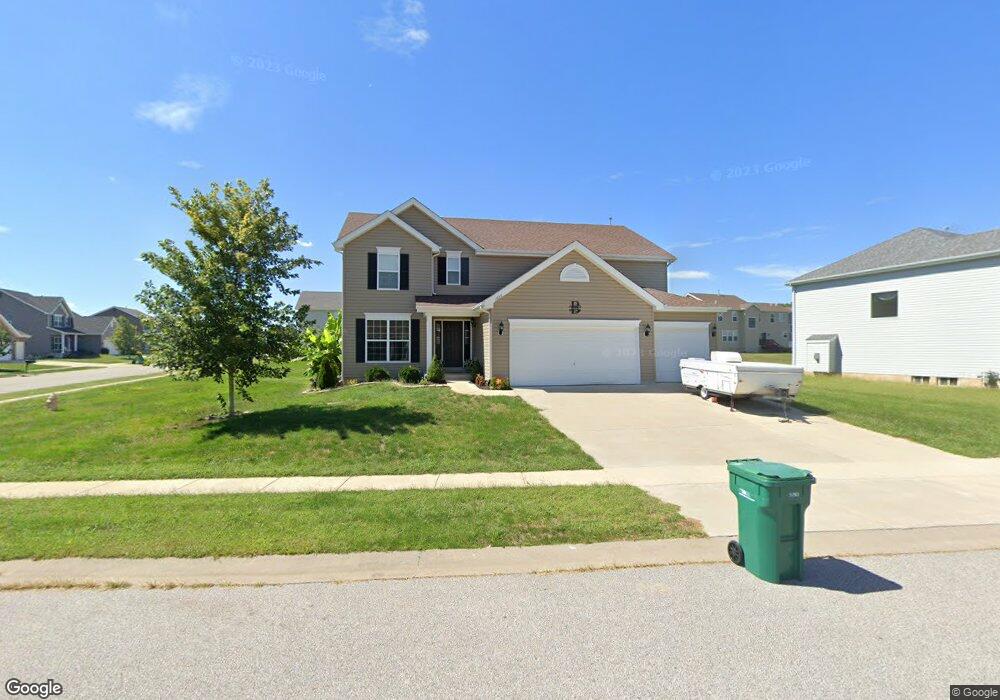
1055 Richland Park Dr O Fallon, IL 62269
Estimated Value: $435,000 - $448,675
--
Bed
--
Bath
3,384
Sq Ft
$131/Sq Ft
Est. Value
About This Home
This home is located at 1055 Richland Park Dr, O Fallon, IL 62269 and is currently estimated at $442,669, approximately $130 per square foot. 1055 Richland Park Dr is a home with nearby schools including Central Elementary School, Joseph Arthur Middle School, and O'Fallon Township High School.
Ownership History
Date
Name
Owned For
Owner Type
Purchase Details
Closed on
Dec 30, 2024
Sold by
Boyd Keith
Bought by
Boyd Takisha
Current Estimated Value
Purchase Details
Closed on
Aug 31, 2017
Sold by
Mcbride Stone Bridge Llc
Bought by
Boyd Keith W and Boyd Takisha K
Home Financials for this Owner
Home Financials are based on the most recent Mortgage that was taken out on this home.
Original Mortgage
$295,088
Interest Rate
4.37%
Mortgage Type
New Conventional
Purchase Details
Closed on
Nov 3, 2016
Sold by
Stone Bridge Estates Development Company
Bought by
Mcbride Stone Bridge Llc
Purchase Details
Closed on
Jul 2, 2010
Sold by
Equity South Llc
Bought by
Stone Bridge Estates Development Company
Purchase Details
Closed on
Jan 31, 2008
Sold by
Centrue Bank
Bought by
Equity South Llc
Home Financials for this Owner
Home Financials are based on the most recent Mortgage that was taken out on this home.
Original Mortgage
$1,303,125
Interest Rate
6.11%
Mortgage Type
Purchase Money Mortgage
Purchase Details
Closed on
Mar 3, 2007
Sold by
Chg Enterprises Inc
Bought by
Centrue Bank
Create a Home Valuation Report for This Property
The Home Valuation Report is an in-depth analysis detailing your home's value as well as a comparison with similar homes in the area
Home Values in the Area
Average Home Value in this Area
Purchase History
| Date | Buyer | Sale Price | Title Company |
|---|---|---|---|
| Boyd Takisha | -- | None Available | |
| Boyd Keith W | $317,500 | Title Partners Agency Llc | |
| Mcbride Stone Bridge Llc | $102,500 | Title Partners Agency Llc | |
| Stone Bridge Estates Development Company | -- | Chicago Title | |
| Equity South Llc | $1,737,500 | Fatic | |
| Centrue Bank | -- | Fatic |
Source: Public Records
Mortgage History
| Date | Status | Borrower | Loan Amount |
|---|---|---|---|
| Previous Owner | Boyd Keith W | $295,088 | |
| Previous Owner | Equity South Llc | $1,303,125 |
Source: Public Records
Tax History Compared to Growth
Tax History
| Year | Tax Paid | Tax Assessment Tax Assessment Total Assessment is a certain percentage of the fair market value that is determined by local assessors to be the total taxable value of land and additions on the property. | Land | Improvement |
|---|---|---|---|---|
| 2024 | $9,554 | $134,785 | $25,483 | $109,302 |
| 2023 | $9,108 | $119,257 | $22,547 | $96,710 |
| 2022 | $8,824 | $116,884 | $22,098 | $94,786 |
| 2021 | $8,695 | $110,938 | $20,974 | $89,964 |
| 2020 | $8,631 | $105,087 | $19,868 | $85,219 |
| 2019 | $8,498 | $105,087 | $19,868 | $85,219 |
| 2018 | $8,147 | $99,533 | $18,546 | $80,987 |
| 2017 | $2,191 | $25,990 | $345 | $25,645 |
| 2016 | $29 | $337 | $337 | $0 |
| 2014 | $28 | $349 | $349 | $0 |
| 2013 | $29 | $355 | $355 | $0 |
Source: Public Records
Map
Nearby Homes
- 1230 Three Rivers Dr Unit 6B
- 762 Kelley Dr
- 906 Powell Dr
- 2268 Haverford Dr
- 210 Meadowbrook Dr
- 208 Ellen Ln
- 1214 Carleton Ln
- 509 Long Dr
- 2763 Cascade Lake Dr
- 1232 Carleton Ln
- 0 Hartman Ln
- 894 Misty Valley Rd
- 5025 Bristol Hill Dr
- 205 Belt Ave
- 2700 Crimson View Dr
- 1433 Victoria Square Ct
- 435 Ponderosa Ave Unit 2
- 2024 Ravenel
- 128 Alice Dr
- 2604 Windsor Crest Ct
- 1012 Sunny Ridge Ct
- 1008 Sunny Ridge Ct
- 1056 Richland Park Dr
- 1201 Stone Hill Dr
- 1056 Richland Park Dr
- 1043 Richland Park Dr
- 1004 Sunny Ridge Ct
- 1052 Richland Park Dr
- 1048 Richland Park Dr
- 1205 Stone Hill Dr
- 1060 Richland Park Dr
- 1209 Stone Hill Dr
- 1013 Sunny Ridge Ct
- 1077 Richland Park Dr
- 1064 Richland Park Dr
- 1044 Richland Park Dr
- 1035 Richland Park Dr
- 1000 Sunny Ridge Ct
- 1009 Sunny Ridge Ct
- 1069 Richland Dr Unit B