NOT LISTED FOR SALE

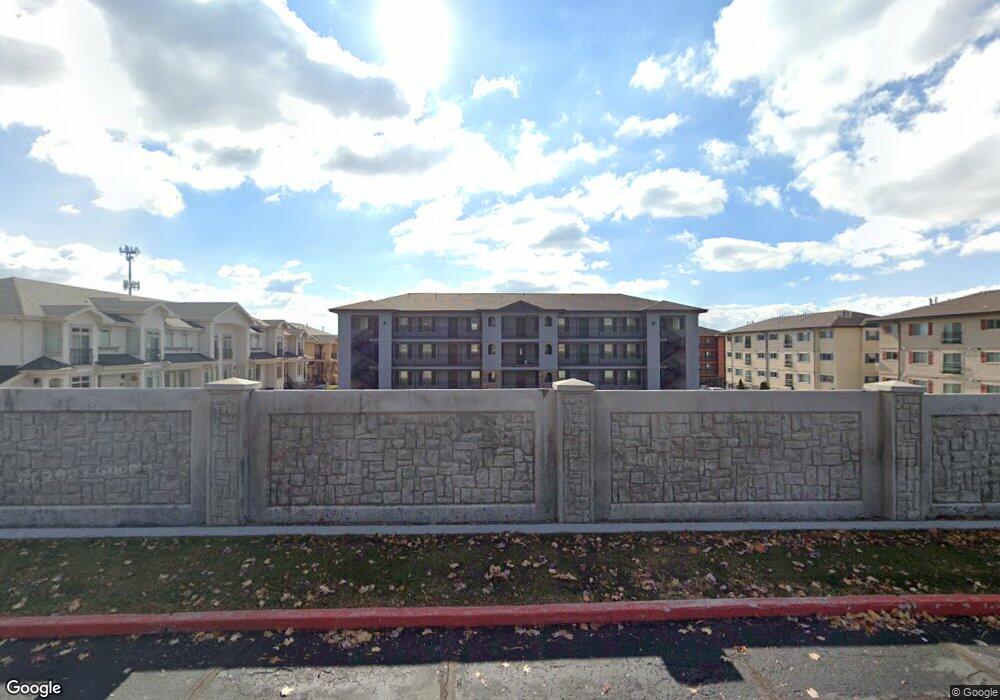
1055 W 1033 N Unit 201 Orem, UT 84057

Bonneville Neighborhood

Estimated Value: $259,704 - $277,000

2 Beds
1 Bath
812 Sq Ft
$329/Sq Ft Est. Value

About This Home

This home is located at 1055 W 1033 N Unit 201, Orem, UT 84057 and is currently estimated at $267,176, approximately $329 per square foot. 1055 W 1033 N Unit 201 is a home located in Utah County with nearby schools including Bonneville Elementary School, Orem Junior High School, and Timpanogos High School.

Ownership History

Date Name Owned For Owner Type

Purchase Details

Closed on
Jun 2, 2022
Sold by
Smart Move Advantage Realty Llc
Bought by
Graham Mckenzie and Horton Caleb
Current Estimated Value
$267,176

Home Financials for this Owner

Home Financials are based on the most recent Mortgage that was taken out on this home.
Original Mortgage
$285,000
Outstanding Balance
$274,209
Interest Rate
5.27%
Mortgage Type
New Conventional
Estimated Equity
-$6,138

Purchase Details

Closed on
Mar 31, 2022
Sold by
Johnson and Jamie
Bought by
Smart Move Advantage Realty Llc

Purchase Details

Closed on
Sep 24, 2018
Sold by
Johnson Devin D and Johnson Jamie N
Bought by
Johnson Devin

Home Financials for this Owner

Home Financials are based on the most recent Mortgage that was taken out on this home.
Original Mortgage
$138,500
Interest Rate
4.5%
Mortgage Type
New Conventional

Purchase Details

Closed on
Nov 10, 2016
Sold by
Johnson Devin
Bought by
Johnson Devin D and Johnson Jamie N

Home Financials for this Owner

Home Financials are based on the most recent Mortgage that was taken out on this home.
Original Mortgage
$137,365
Interest Rate
4.5%
Mortgage Type
FHA

Range of Values:

Collateral Analytics

Collateral Analytics Collateral Analytics AVMs (Automated Valuation Model) employ a number of statistical approaches combined with neighborhood-specific comparable selection guarantees the most up-to-date and precise valuations.

Not Available

Collateral Analytics does not have data for the current month. Please view the chart for historical values.

ICE

ICE Mortgage Technology ICE Mortgage Technology’s AVM (Automated Valuation Model) is a state-of-the-art online residential property valuation tool that provides a quick and accurate estimate of the value of almost any home in the U.S.

Not Available

ICE Mortgage Technology does not have data for the current month. Please view the chart for historical values.

First American

First American First American Data & Analytics’ next-generation AVM combines unrivaled data assets with a blended ensemble of valuation models to produce highly accurate, reliable valuations you can trust.

Not Available

First American does not have data for the current month. Please view the chart for historical values.

Quantarium

Quantarium Quantarium’s valuation service, repeatedly proven the industry’s most accurate and comprehensive, is supercharged with a self-learning and auto-tuning AI engine that continually becomes smarter and more accurate as it processes daily inputs from the industry’s leading RE data lake.

Not Available

Quantarium does not have data for the current month. Please view the chart for historical values.

Average Value
Not Available
List Price
Sold Price
Create a Home Valuation Report for This Property
The Home Valuation Report is an in-depth analysis detailing your home's value as well as a comparison with similar homes in the area

Home Values in the Area

Source: Public Records

Average Home Value in this Area


Source: Public Records

Purchase History

Date Buyer Sale Price Title Company
Smart Move Advantage Realty Llc -- Cottonwood Title
Johnson Devin -- Hickman Land Title Layton
Johnson Devin D -- None Available
Johnson Devin -- United West Title
Source: Public Records

Mortgage History

Date Status Borrower Loan Amount
Previous Owner Johnson Devin $141,000
Previous Owner Johnson Devin $138,500
Previous Owner Johnson Devin $137,365
Source: Public Records

Tax History Compared to Growth

Source: Public Records

Tax History

Year Tax Paid Tax Assessment Tax Assessment Total Assessment is a certain percentage of the fair market value that is determined by local assessors to be the total taxable value of land and additions on the property. Land Improvement
2024 $1,152 $140,855 $0 $0
2023 $1,044 $137,170 $0 $0
2022 $1,046 $133,155 $0 $0
2021 $985 $189,900 $22,800 $167,100
2020 $894 $169,500 $20,300 $149,200
2019 $827 $163,000 $24,500 $138,500
2018 $818 $154,000 $21,000 $133,000
2017 $758 $76,450 $0 $0
Source: Public Records

Map