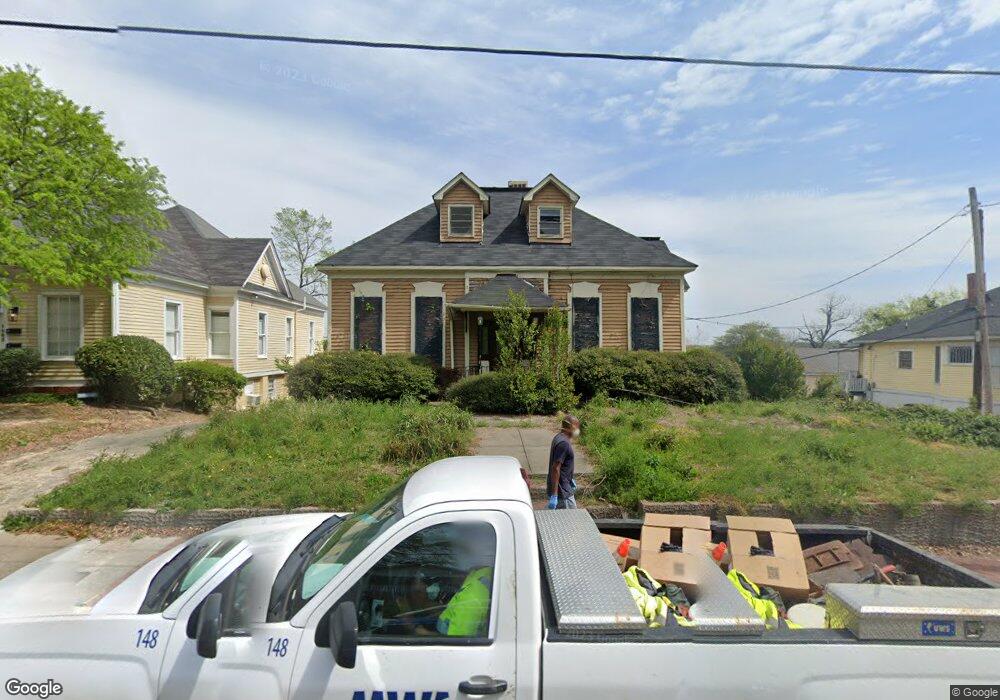
1055 Walnut St Macon, GA 31201
InTown NeighborhoodEstimated Value: $112,386
Studio
4
Baths
2,476
Sq Ft
$45/Sq Ft
Est. Value
About This Home
This home is located at 1055 Walnut St, Macon, GA 31201 and is currently priced at $112,386, approximately $45 per square foot. 1055 Walnut St is a home located in Bibb County with nearby schools including Williams Elementary School, Miller Fine Arts Magnet Middle School, and Central High School.
Ownership History
Date
Name
Owned For
Owner Type
Purchase Details
Closed on
Feb 28, 2020
Sold by
Carriage Town Llc
Bought by
Peach 1055 Walnut Llc
Current Estimated Value
Purchase Details
Closed on
Oct 26, 2017
Sold by
Pref Ii Cer Ga Llc
Bought by
Carriage Town Llc
Home Financials for this Owner
Home Financials are based on the most recent Mortgage that was taken out on this home.
Original Mortgage
$35,000
Interest Rate
3.83%
Mortgage Type
Construction
Purchase Details
Closed on
Oct 9, 2015
Sold by
Cbna Ga Llc
Bought by
Rref Ii Cer Ga Llc
Purchase Details
Closed on
Mar 26, 2015
Sold by
United Finance & Develpmt
Bought by
Certusbank N.A.
Purchase Details
Closed on
Jan 13, 2006
Bought by
United Finance & Develpmt
Purchase Details
Closed on
Mar 30, 2004
Create a Home Valuation Report for This Property
The Home Valuation Report is an in-depth analysis detailing your home's value as well as a comparison with similar homes in the area
Home Values in the Area
Average Home Value in this Area
Purchase History
| Date | Buyer | Sale Price | Title Company |
|---|---|---|---|
| Peach 1055 Walnut Llc | $69,000 | None Available | |
| Carriage Town Llc | $35,000 | None Available | |
| Rref Ii Cer Ga Llc | $2,199 | -- | |
| Certusbank N.A. | -- | -- | |
| United Finance & Develpmt | $180,000 | -- | |
| -- | -- | -- | |
| -- | $125,000 | -- |
Source: Public Records
Mortgage History
| Date | Status | Borrower | Loan Amount |
|---|---|---|---|
| Previous Owner | Carriage Town Llc | $35,000 |
Source: Public Records
Tax History
| Year | Tax Paid | Tax Assessment Tax Assessment Total Assessment is a certain percentage of the fair market value that is determined by local assessors to be the total taxable value of land and additions on the property. | Land | Improvement |
|---|---|---|---|---|
| 2025 | $460 | $28,090 | $4,718 | $23,372 |
| 2024 | $475 | $28,090 | $4,718 | $23,372 |
| 2023 | $554 | $28,090 | $4,718 | $23,372 |
| 2022 | $648 | $18,917 | $4,718 | $14,199 |
| 2021 | $711 | $18,917 | $4,718 | $14,199 |
| 2020 | $727 | $18,717 | $4,718 | $13,999 |
| 2019 | $733 | $18,717 | $4,718 | $13,999 |
| 2018 | $839 | $30,744 | $4,718 | $26,026 |
| 2017 | $1,432 | $38,219 | $4,718 | $33,501 |
| 2016 | $1,322 | $38,218 | $4,718 | $33,501 |
| 2015 | $1,883 | $38,452 | $9,435 | $29,017 |
| 2014 | $2,180 | $38,715 | $9,435 | $29,280 |
Source: Public Records
Map
Nearby Homes
- 312 College St Unit 3
- 132 Madison St
- 1120 Georgia Ave
- 417 Orange St
- 349 Madison St
- 353 Madison St
- 338 Monroe St
- 1740 5th Ave W
- 619 College St
- 1812 5th Ave W
- 676 College St
- 632 Monroe St
- 336 Empire Ave
- 1837 2nd Ave
- 565 Poplar St
- 253 Pursley St
- 522 Cherry St Unit 301
- 522 Cherry St Unit 201
- 534 2nd St
- 833 Parkview Ct
- 1063 Walnut St
- 183 Hill St
- 1047 Walnut St
- 169 Hill St
- 1071 Walnut St Unit C
- 1071 Walnut St
- 190 Hill St
- 151 Walnut St
- 1079 Walnut St Unit C
- 1079 Walnut St Unit B
- 1079 Walnut St Unit A
- 1079 Walnut St
- 1043 Walnut St
- 155 Hill St
- 152 Hill St
- 143 Hill St
- 1062 Walnut St
- 1054 Walnut St
- 1087 Walnut St
- 1072 Walnut St Unit B
Your Personal Tour Guide
Ask me questions while you tour the home.