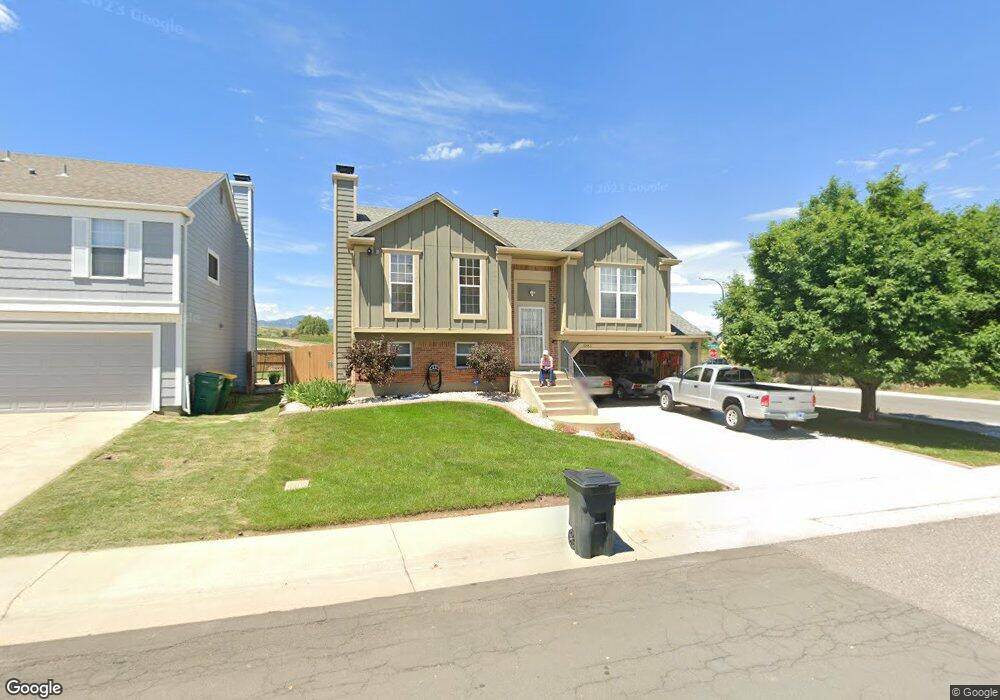
10553 Routt Ln Westminster, CO 80021
Walnut Grove NeighborhoodEstimated Value: $486,000 - $568,000
2
Beds
3
Baths
927
Sq Ft
$572/Sq Ft
Est. Value
About This Home
This home is located at 10553 Routt Ln, Westminster, CO 80021 and is currently estimated at $530,503, approximately $572 per square foot. 10553 Routt Ln is a home located in Jefferson County with nearby schools including Lukas Elementary School, Wayne Carle Middle School, and Standley Lake High School.
Ownership History
Date
Name
Owned For
Owner Type
Purchase Details
Closed on
Mar 30, 2001
Sold by
Vipond Thomas J Proctor Karen K
Bought by
Proctor Karen K
Current Estimated Value
Home Financials for this Owner
Home Financials are based on the most recent Mortgage that was taken out on this home.
Original Mortgage
$109,200
Outstanding Balance
$40,585
Interest Rate
7.13%
Estimated Equity
$489,918
Purchase Details
Closed on
May 24, 1996
Sold by
Eich Catherine Jill
Bought by
Vipond Thomas J and Proctor Karen K
Home Financials for this Owner
Home Financials are based on the most recent Mortgage that was taken out on this home.
Original Mortgage
$116,156
Interest Rate
7.93%
Mortgage Type
FHA
Purchase Details
Closed on
Mar 1, 1995
Sold by
Eich Douglas L
Bought by
Eich Catherine Jill
Home Financials for this Owner
Home Financials are based on the most recent Mortgage that was taken out on this home.
Original Mortgage
$10,940
Interest Rate
8.72%
Create a Home Valuation Report for This Property
The Home Valuation Report is an in-depth analysis detailing your home's value as well as a comparison with similar homes in the area
Home Values in the Area
Average Home Value in this Area
Purchase History
| Date | Buyer | Sale Price | Title Company |
|---|---|---|---|
| Proctor Karen K | -- | -- | |
| Vipond Thomas J | $117,000 | -- | |
| Eich Catherine Jill | -- | Land Title |
Source: Public Records
Mortgage History
| Date | Status | Borrower | Loan Amount |
|---|---|---|---|
| Open | Proctor Karen K | $109,200 | |
| Closed | Vipond Thomas J | $116,156 | |
| Previous Owner | Eich Catherine Jill | $10,940 |
Source: Public Records
Tax History Compared to Growth
Tax History
| Year | Tax Paid | Tax Assessment Tax Assessment Total Assessment is a certain percentage of the fair market value that is determined by local assessors to be the total taxable value of land and additions on the property. | Land | Improvement |
|---|---|---|---|---|
| 2024 | $2,462 | $32,323 | $12,914 | $19,409 |
| 2023 | $2,462 | $32,323 | $12,914 | $19,409 |
| 2022 | $1,933 | $24,853 | $7,937 | $16,916 |
| 2021 | $1,961 | $25,568 | $8,165 | $17,403 |
| 2020 | $1,807 | $23,695 | $7,478 | $16,217 |
| 2019 | $1,778 | $23,695 | $7,478 | $16,217 |
| 2018 | $1,663 | $21,424 | $6,870 | $14,554 |
| 2017 | $1,489 | $21,424 | $6,870 | $14,554 |
| 2016 | $1,364 | $18,207 | $5,694 | $12,513 |
| 2015 | $1,149 | $18,207 | $5,694 | $12,513 |
| 2014 | $1,149 | $14,304 | $5,476 | $8,828 |
Source: Public Records
Map
Nearby Homes
- 11476 W 105th Dr
- 11496 W 106th Way
- 10411 Routt Ln
- 10541 Routt St
- 11461 W 107th Place
- 11437 W 103rd Ave
- 11321 W 107th Ave
- 10307 Owens St
- 11221 W 107th Ave
- 10571 Parfet Ct
- 10632 Van Gordon Way Unit 1
- 12243 Meadowlark Ln
- 10680 W Big Horn Cir
- 10741 Owens St
- 12556 W Montane Dr
- 12331 Red Fox Way
- 10665 Newcombe St
- 10947 W 100th Dr
- 10687 W 107th Ave
- 10834 Graphite St
- 10547 Routt Ln
- 10543 Routt Ln
- 10557 Routt Ln
- 11496 W 105th Dr
- 10537 Routt Ln
- 11499 W 105th Way
- 10561 Routt Ln
- 11497 W 105th Dr
- 11486 W 105th Dr
- 10531 Routt Ln
- 11495 W 105th Way
- 11487 W 105th Dr
- 10562 Routt Ln
- 11489 W 105th Way
- 10527 Routt Ln
- 11467 W 105th Dr
- 10571 Routt Ln
- 10568 Routt Ln
- 11498 W 105th Way
- 11466 W 105th Dr