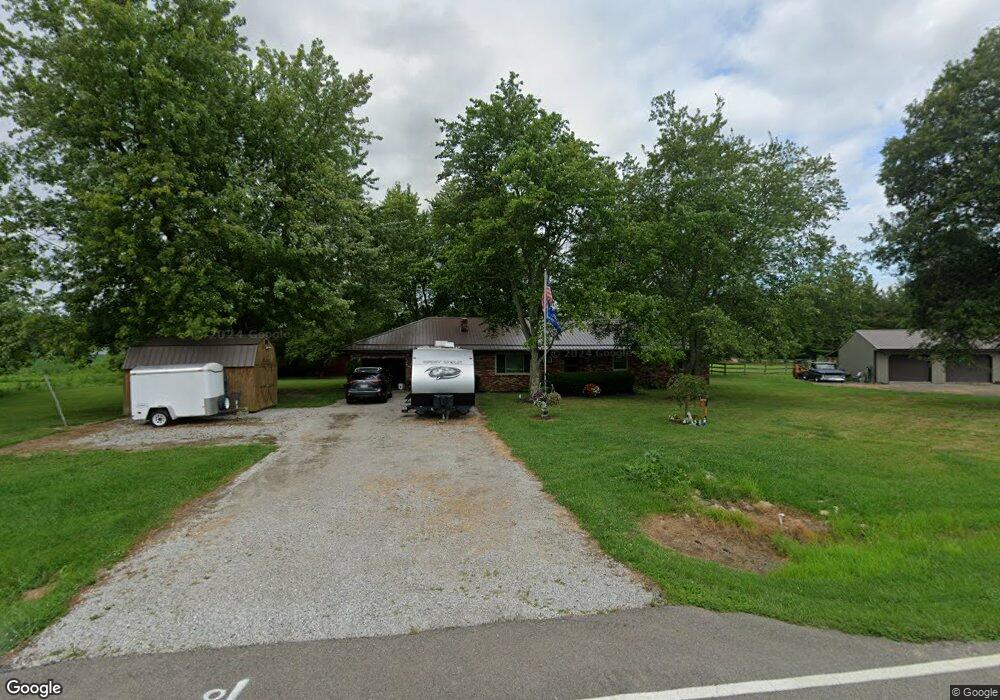
10558 Morrow Woodville Rd Blanchester, OH 45107
Estimated Value: $227,000 - $478,000
4
Beds
2
Baths
2,552
Sq Ft
$137/Sq Ft
Est. Value
About This Home
This home is located at 10558 Morrow Woodville Rd, Blanchester, OH 45107 and is currently estimated at $348,592, approximately $136 per square foot. 10558 Morrow Woodville Rd is a home located in Warren County with nearby schools including Mike Moseley Elementary School, Little Miami Early Childhood Center, and Little Miami Intermediate Middle School.
Ownership History
Date
Name
Owned For
Owner Type
Purchase Details
Closed on
Mar 24, 2011
Sold by
Deutsche Bank National Trust Company
Bought by
Rhoads James T
Current Estimated Value
Home Financials for this Owner
Home Financials are based on the most recent Mortgage that was taken out on this home.
Original Mortgage
$62,000
Outstanding Balance
$42,880
Interest Rate
4.93%
Mortgage Type
New Conventional
Estimated Equity
$305,712
Purchase Details
Closed on
Jul 30, 2010
Sold by
Hedberg Roy I and Case #09Cv74278
Bought by
Deutsche Bank National Trust Company
Purchase Details
Closed on
Sep 30, 1994
Sold by
Lawson Willard C
Bought by
Hedberg Roy I and Hedberg Denise L
Home Financials for this Owner
Home Financials are based on the most recent Mortgage that was taken out on this home.
Original Mortgage
$80,900
Interest Rate
8.6%
Mortgage Type
New Conventional
Create a Home Valuation Report for This Property
The Home Valuation Report is an in-depth analysis detailing your home's value as well as a comparison with similar homes in the area
Home Values in the Area
Average Home Value in this Area
Purchase History
| Date | Buyer | Sale Price | Title Company |
|---|---|---|---|
| Rhoads James T | $80,000 | Prism Title & Closing Servic | |
| Deutsche Bank National Trust Company | $113,334 | None Available | |
| Hedberg Roy I | $89,900 | -- |
Source: Public Records
Mortgage History
| Date | Status | Borrower | Loan Amount |
|---|---|---|---|
| Open | Rhoads James T | $62,000 | |
| Previous Owner | Hedberg Roy I | $80,900 |
Source: Public Records
Tax History Compared to Growth
Tax History
| Year | Tax Paid | Tax Assessment Tax Assessment Total Assessment is a certain percentage of the fair market value that is determined by local assessors to be the total taxable value of land and additions on the property. | Land | Improvement |
|---|---|---|---|---|
| 2024 | $3,375 | $113,040 | $25,800 | $87,240 |
| 2023 | $2,909 | $93,453 | $15,834 | $77,619 |
| 2022 | $2,871 | $93,454 | $15,834 | $77,620 |
| 2021 | $2,744 | $93,454 | $15,834 | $77,620 |
| 2020 | $2,612 | $75,978 | $12,873 | $63,105 |
| 2019 | $2,706 | $75,978 | $12,873 | $63,105 |
| 2018 | $2,722 | $75,978 | $12,873 | $63,105 |
| 2017 | $2,305 | $63,035 | $12,373 | $50,663 |
| 2016 | $2,386 | $63,035 | $12,373 | $50,663 |
| 2015 | $2,386 | $63,035 | $12,373 | $50,663 |
| 2014 | $2,293 | $59,410 | $12,060 | $47,350 |
| 2013 | $2,366 | $68,870 | $12,870 | $56,000 |
Source: Public Records
Map
Nearby Homes
- 10834 State Route 28
- 2011 Fayetteville Rd
- 753 W Main St
- 9109 Bindley Mounts Rd
- 507 Bourbon St
- 305 W Main St
- 315 Rayford St
- 502 Railroad St
- 8347 McCulley Ln
- 301 W Main St
- 128 W Burroughs St
- 107 Central Ave
- 0 Ohio 123 Unit 11 938995
- 0 Ohio 123 Unit 1848086
- 503 S Broadway St
- 213 N Broadway St
- 409 N Broadway St
- 7484 Fairground Rd
- 401 N Wright St
- 7478 Fairground Rd
- 10575 Morrow Woodville Rd
- 10605 Morrow Woodville Rd
- 10496 Morrow Woodville Rd
- 9658 Morrow Woodville Rd
- 10515 Morrow Woodville Rd
- 10583 Vandervoort Rd
- 10651 Vandervoort Rd
- 10662 Morrow Woodville Rd
- 10630 Vandervoort Rd
- 10644 Vandervoort Rd
- 0 Morrow Woodville Rd Unit 1749199
- 0 Morrow Woodville Rd
- 9722 Morrow Woodville Rd
- 6ac Morrow Woodville Rd
- 48ac Morrow Woodville Rd
- A Morrow Woodville Rd
- 10420 Morrow Woodville Rd
- 10688 Morrow Woodville Rd
- 10715 Vandervoort Rd
- 10741 Vandervoort Rd