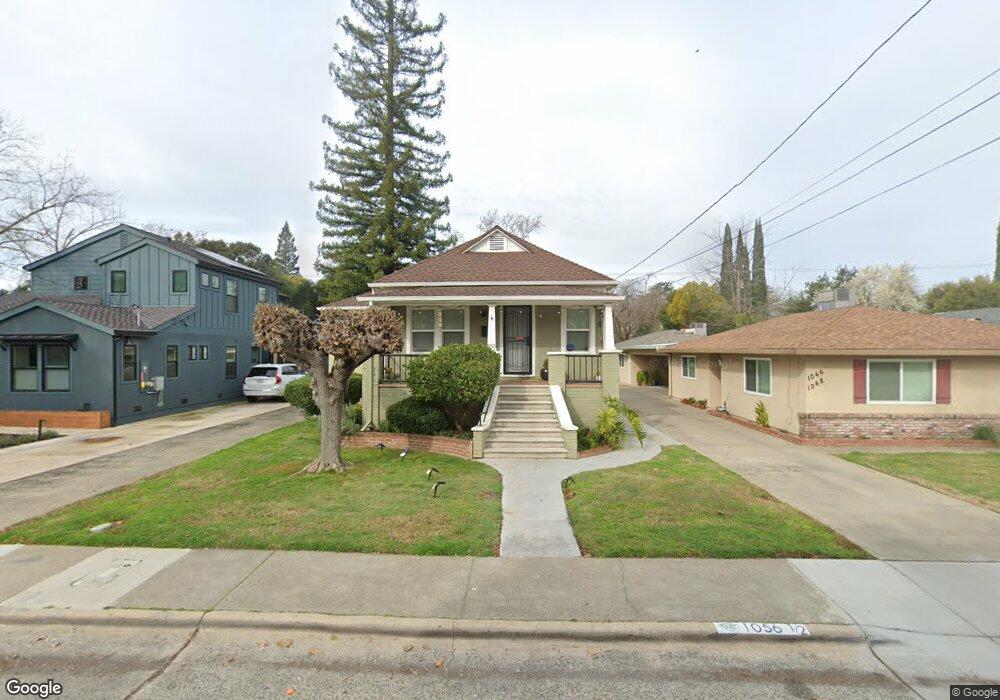
1056 48th St Sacramento, CA 95819
East Sacramento NeighborhoodEstimated Value: $640,088 - $761,000
2
Beds
1
Bath
849
Sq Ft
$822/Sq Ft
Est. Value
About This Home
This home is located at 1056 48th St, Sacramento, CA 95819 and is currently estimated at $698,272, approximately $822 per square foot. 1056 48th St is a home located in Sacramento County with nearby schools including Caleb Greenwood Elementary, Umoja International Academy, and Hiram W. Johnson High School.
Ownership History
Date
Name
Owned For
Owner Type
Purchase Details
Closed on
Oct 4, 2012
Sold by
Lo Giudice Gloria Josephine
Bought by
Lo Giudice Gloria and The Gloria Lo Giudice Trust
Current Estimated Value
Purchase Details
Closed on
Sep 17, 2012
Sold by
Giudice Alberto Philip Lo
Bought by
Giudice Albert P Lo and The Albert P Lo Giudice Trust
Purchase Details
Closed on
Sep 16, 2009
Sold by
Giudice Alberto Philip Lo and Giudice Joseph
Bought by
Giudice Alberto Philip Lo and Giudice Gloria Josephine Lo
Purchase Details
Closed on
Sep 20, 1999
Sold by
Trust Joseph & Livia Lo Giudice Rev 1991 and Logiudice Joseph
Bought by
Logiudice Joseph and Logiudice Alberto Philip
Create a Home Valuation Report for This Property
The Home Valuation Report is an in-depth analysis detailing your home's value as well as a comparison with similar homes in the area
Home Values in the Area
Average Home Value in this Area
Purchase History
| Date | Buyer | Sale Price | Title Company |
|---|---|---|---|
| Lo Giudice Gloria | -- | None Available | |
| Giudice Albert P Lo | -- | None Available | |
| Giudice Alberto Philip Lo | -- | None Available | |
| Logiudice Joseph | -- | -- |
Source: Public Records
Tax History
| Year | Tax Paid | Tax Assessment Tax Assessment Total Assessment is a certain percentage of the fair market value that is determined by local assessors to be the total taxable value of land and additions on the property. | Land | Improvement |
|---|---|---|---|---|
| 2025 | $924 | $62,427 | $21,304 | $41,123 |
| 2024 | $924 | $61,204 | $20,887 | $40,317 |
| 2023 | $902 | $60,005 | $20,478 | $39,527 |
| 2022 | $885 | $58,829 | $20,077 | $38,752 |
| 2021 | $847 | $57,677 | $19,684 | $37,993 |
| 2020 | $849 | $57,087 | $19,483 | $37,604 |
| 2019 | $832 | $55,968 | $19,101 | $36,867 |
| 2018 | $811 | $54,872 | $18,727 | $36,145 |
| 2017 | $798 | $53,797 | $18,360 | $35,437 |
| 2016 | $757 | $52,743 | $18,000 | $34,743 |
| 2015 | $744 | $51,952 | $17,730 | $34,222 |
| 2014 | $731 | $50,940 | $17,387 | $33,553 |
Source: Public Records
Map
Nearby Homes
Your Personal Tour Guide
Ask me questions while you tour the home.