Estimated Value: $255,048 - $285,000
3
Beds
2
Baths
1,484
Sq Ft
$182/Sq Ft
Est. Value
About This Home
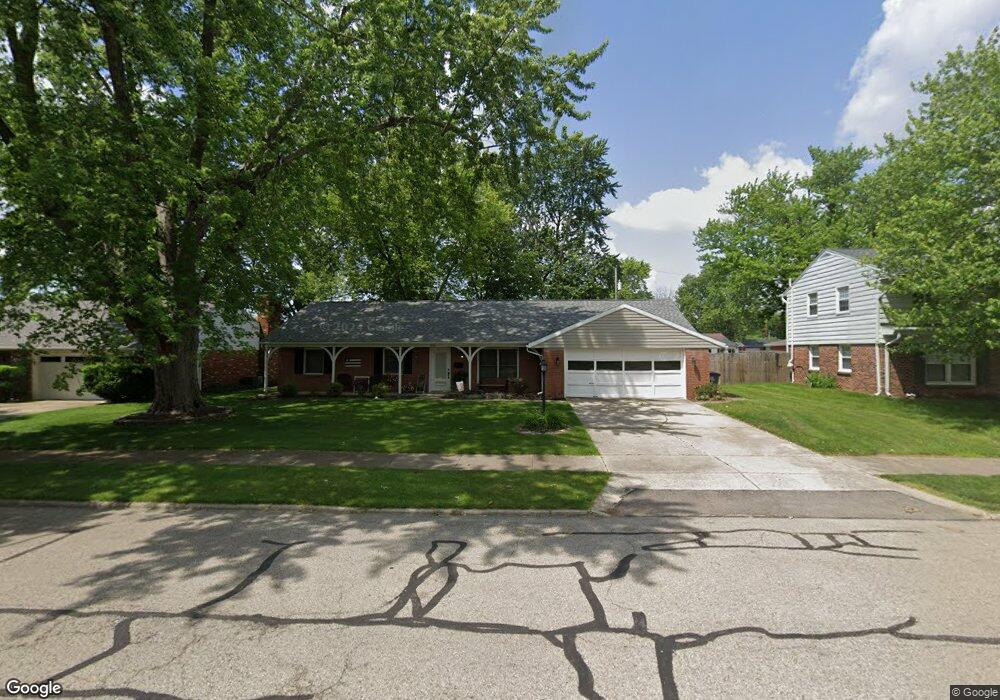
This home is located at 1056 Crestview Dr, Troy, OH 45373 and is currently estimated at $270,762, approximately $182 per square foot. 1056 Crestview Dr is a home located in Miami County with nearby schools including Cookson Elementary School, Troy Junior High School, and Van Cleve Elementary School.
Ownership History
Date
Name
Owned For
Owner Type
Purchase Details
Closed on
Jan 16, 2001
Sold by
Halterman Robin S and Powell Robin S
Bought by
Powell John W and Powell Robin S
Current Estimated Value
Purchase Details
Closed on
Feb 1, 1987
Bought by
Halterman Robin S
Create a Home Valuation Report for This Property
The Home Valuation Report is an in-depth analysis detailing your home's value as well as a comparison with similar homes in the area
Home Values in the Area
Average Home Value in this Area
Purchase History
| Date | Buyer | Sale Price | Title Company |
|---|---|---|---|
| Powell John W | -- | -- | |
| Halterman Robin S | -- | -- |
Source: Public Records
Tax History
| Year | Tax Paid | Tax Assessment Tax Assessment Total Assessment is a certain percentage of the fair market value that is determined by local assessors to be the total taxable value of land and additions on the property. | Land | Improvement |
|---|---|---|---|---|
| 2025 | $1,880 | $74,940 | $12,850 | $62,090 |
| 2024 | $1,880 | $66,230 | $13,900 | $52,330 |
| 2023 | $2,127 | $66,230 | $13,900 | $52,330 |
| 2022 | $1,805 | $66,230 | $13,900 | $52,330 |
| 2021 | $1,394 | $50,930 | $10,680 | $40,250 |
| 2020 | $1,396 | $50,930 | $10,680 | $40,250 |
| 2019 | $1,409 | $50,930 | $10,680 | $40,250 |
| 2018 | $1,539 | $44,350 | $10,710 | $33,640 |
| 2017 | $1,555 | $44,350 | $10,710 | $33,640 |
| 2016 | $1,531 | $44,350 | $10,710 | $33,640 |
| 2015 | $1,480 | $41,060 | $9,910 | $31,150 |
| 2014 | $1,480 | $41,060 | $9,910 | $31,150 |
| 2013 | $1,489 | $41,060 | $9,910 | $31,150 |
Source: Public Records
Map
Nearby Homes
- 555 Miami St
- 1210 Charleston Ct
- 1142 Lee Rd
- 984 Mystic Ln
- 708 N Market St
- 1057 Stonyridge Ave
- 1334 Skylark Dr
- 1206 Heritage Dr
- 1329 Lee Rd
- 506 Michigan Ave
- 598 N Market St
- 607 W Bentley Cir
- 1257 Gettysburg Dr
- 491 Mayfield Square E
- 1160 Waterloo St
- 1164 Waterloo St
- 755 W Bentley Cir
- 1188 E Bentley Cir
- 1424 Michael Dr
- 1137 Auburn St
- 1044 Crestview Dr
- 1078 Crestview Dr
- 1053 Meadow Ln
- 1063 Meadow Ln
- 1039 Meadow Ln
- 1032 Crestview Dr
- 1090 Crestview Dr
- 1051 Crestview Dr
- 1075 Meadow Ln
- 1027 Meadow Ln
- 1041 Crestview Dr
- 1091 Crestview Dr
- 1020 Crestview Dr
- 1120 Crestview Dr
- 1087 Meadow Ln
- 1025 Crestview Dr
- 1015 Meadow Ln
- 1054 Meadow Ln
- 1046 Meadow Ln
- 1010 Maplecrest Dr
Your Personal Tour Guide
Ask me questions while you tour the home.