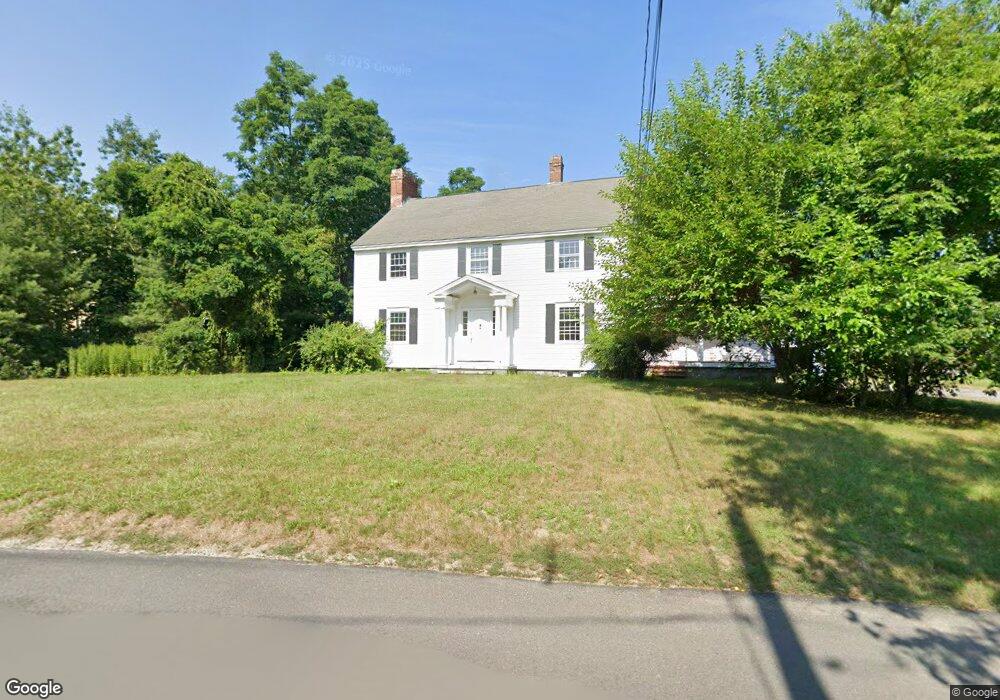
1056 Curve St Carlisle, MA 01741
Estimated Value: $1,131,000 - $1,179,430
4
Beds
2
Baths
2,280
Sq Ft
$508/Sq Ft
Est. Value
About This Home
This home is located at 1056 Curve St, Carlisle, MA 01741 and is currently estimated at $1,159,108, approximately $508 per square foot. 1056 Curve St is a home located in Middlesex County with nearby schools including Carlisle School and Concord Carlisle High School.
Ownership History
Date
Name
Owned For
Owner Type
Purchase Details
Closed on
Nov 29, 2011
Sold by
Swanson John M
Bought by
1056 Curve Street T and Osborn Sandra L
Current Estimated Value
Home Financials for this Owner
Home Financials are based on the most recent Mortgage that was taken out on this home.
Original Mortgage
$250,000
Outstanding Balance
$171,917
Interest Rate
4.12%
Mortgage Type
Purchase Money Mortgage
Estimated Equity
$987,191
Purchase Details
Closed on
Apr 26, 2006
Sold by
Swanson John M
Bought by
Gladstone Philip J S
Create a Home Valuation Report for This Property
The Home Valuation Report is an in-depth analysis detailing your home's value as well as a comparison with similar homes in the area
Home Values in the Area
Average Home Value in this Area
Purchase History
| Date | Buyer | Sale Price | Title Company |
|---|---|---|---|
| 1056 Curve Street T | -- | -- | |
| Gladstone Philip J S | $475,000 | -- |
Source: Public Records
Mortgage History
| Date | Status | Borrower | Loan Amount |
|---|---|---|---|
| Open | 1056 Curve Street T | $250,000 |
Source: Public Records
Tax History Compared to Growth
Tax History
| Year | Tax Paid | Tax Assessment Tax Assessment Total Assessment is a certain percentage of the fair market value that is determined by local assessors to be the total taxable value of land and additions on the property. | Land | Improvement |
|---|---|---|---|---|
| 2025 | $13,569 | $1,029,500 | $607,800 | $421,700 |
| 2024 | $12,715 | $953,900 | $564,200 | $389,700 |
| 2023 | $12,298 | $869,100 | $543,100 | $326,000 |
| 2022 | $11,859 | $718,700 | $437,000 | $281,700 |
| 2021 | $11,700 | $718,700 | $437,000 | $281,700 |
| 2020 | $11,596 | $631,600 | $349,900 | $281,700 |
| 2019 | $11,428 | $624,800 | $349,900 | $274,900 |
| 2018 | $11,353 | $624,800 | $349,900 | $274,900 |
| 2017 | $11,009 | $624,800 | $349,900 | $274,900 |
| 2016 | $10,747 | $624,800 | $349,900 | $274,900 |
| 2015 | $10,739 | $565,200 | $336,800 | $228,400 |
| 2014 | $10,535 | $565,200 | $336,800 | $228,400 |
Source: Public Records
Map
Nearby Homes
- 1056 Curve St
- 1420 Curve St
- 32 Vose Hill Rd
- 12 Martin St
- 57 Sleigh Rd
- 702 Lowell St
- 160 Rockland Rd
- 5 Carriage Dr
- 7 Little Bear Hill Rd
- 0 Judy Farm Rd
- 225 Lowell St
- 0 Heald Rd
- 244 Bingham Rd
- 9 Lakeside Ave
- 4 Kay's Walk Unit 15
- 2 Kay's Walk Unit 18
- 14 Kay's Walk
- 6 Kay's Walk Unit 6
- 6 Kay's Walk
- 8 Kay's Walk Unit 13