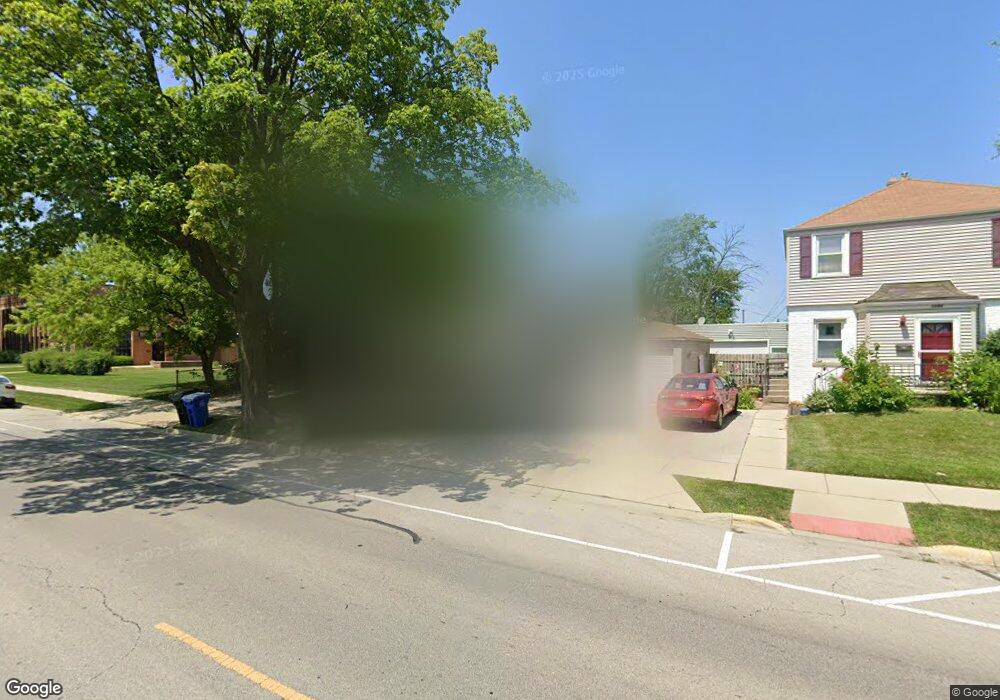
1056 E Thacker St Des Plaines, IL 60016
Estimated Value: $372,000 - $421,000
4
Beds
2
Baths
1,674
Sq Ft
$236/Sq Ft
Est. Value
About This Home
This home is located at 1056 E Thacker St, Des Plaines, IL 60016 and is currently estimated at $394,965, approximately $235 per square foot. 1056 E Thacker St is a home located in Cook County with nearby schools including Forest Elementary School, Algonquin Middle School, and Maine West High School.
Ownership History
Date
Name
Owned For
Owner Type
Purchase Details
Closed on
Oct 30, 2002
Sold by
Urso Michael P and Urso Kelly A
Bought by
Rodriguez Concepcion and Rodriguez Yalila P
Current Estimated Value
Home Financials for this Owner
Home Financials are based on the most recent Mortgage that was taken out on this home.
Original Mortgage
$206,625
Outstanding Balance
$84,292
Interest Rate
6.18%
Estimated Equity
$310,673
Purchase Details
Closed on
Dec 8, 1999
Sold by
Devon Bank
Bought by
Urso Michael P and Urso Kelly A
Home Financials for this Owner
Home Financials are based on the most recent Mortgage that was taken out on this home.
Original Mortgage
$150,400
Interest Rate
7.87%
Purchase Details
Closed on
May 20, 1996
Sold by
Petersen Barry D and Petersen Lisa M
Bought by
Meyers Marilyn
Home Financials for this Owner
Home Financials are based on the most recent Mortgage that was taken out on this home.
Original Mortgage
$110,000
Interest Rate
8.1%
Create a Home Valuation Report for This Property
The Home Valuation Report is an in-depth analysis detailing your home's value as well as a comparison with similar homes in the area
Home Values in the Area
Average Home Value in this Area
Purchase History
| Date | Buyer | Sale Price | Title Company |
|---|---|---|---|
| Rodriguez Concepcion | $217,500 | Republic Title | |
| Urso Michael P | $180,500 | -- | |
| Meyers Marilyn | $151,000 | -- |
Source: Public Records
Mortgage History
| Date | Status | Borrower | Loan Amount |
|---|---|---|---|
| Open | Rodriguez Concepcion | $206,625 | |
| Previous Owner | Urso Michael P | $150,400 | |
| Previous Owner | Meyers Marilyn | $110,000 |
Source: Public Records
Tax History
| Year | Tax Paid | Tax Assessment Tax Assessment Total Assessment is a certain percentage of the fair market value that is determined by local assessors to be the total taxable value of land and additions on the property. | Land | Improvement |
|---|---|---|---|---|
| 2025 | $5,944 | $37,000 | $5,751 | $31,249 |
| 2024 | $5,944 | $28,515 | $4,793 | $23,722 |
| 2023 | $5,753 | $28,515 | $4,793 | $23,722 |
| 2022 | $5,753 | $28,515 | $4,793 | $23,722 |
| 2021 | $4,097 | $19,323 | $3,834 | $15,489 |
| 2020 | $4,152 | $19,323 | $3,834 | $15,489 |
| 2019 | $4,117 | $21,470 | $3,834 | $17,636 |
| 2018 | $5,740 | $25,378 | $3,354 | $22,024 |
| 2017 | $5,671 | $25,378 | $3,354 | $22,024 |
| 2016 | $5,863 | $25,378 | $3,354 | $22,024 |
| 2015 | $5,988 | $24,303 | $2,875 | $21,428 |
| 2014 | $5,889 | $24,303 | $2,875 | $21,428 |
| 2013 | $5,712 | $24,303 | $2,875 | $21,428 |
Source: Public Records
Map
Nearby Homes
- 1107 E Prairie Ave
- 886 E Thacker St
- 1277 E Thacker St Unit 303
- 1005 Woodlawn Ave
- 799 Graceland Ave Unit 404A
- 787 Graceland Ave Unit 202B
- 1048 E Walnut Ave
- 900 Center St Unit 3A
- 584 S 4th Ave
- 821 Lexington Cir E
- 1380 Oakwood Ave Unit 306
- 905 Center St Unit B208
- 1325 Perry St Unit 606
- 890 North Ave
- 390 S Western Ave Unit 706
- 1258 Brown St Unit 302
- 1330 Perry St Unit 504
- 652 E Prairie Ave
- 1378 Perry St Unit 412
- 980 W Grant Dr
- 1068 E Thacker St
- 1066 E Thacker St
- 1070 E Thacker St
- 1072 E Thacker St
- 1076 E Thacker St
- 1074 E Thacker St
- 1045 E Thacker St
- 812 Margret St
- 1094 E Thacker St
- 1087 Rose Ave
- 1015 E Thacker St
- 1095 Rose Ave
- 824 Margret St
- 811 S 2nd Ave
- 1099 Rose Ave
- 828 Margret St
- 1054 Rose Ave
- 1036 Rose Ave
- 1046 Rose Ave
- 1062 Rose Ave
Your Personal Tour Guide
Ask me questions while you tour the home.