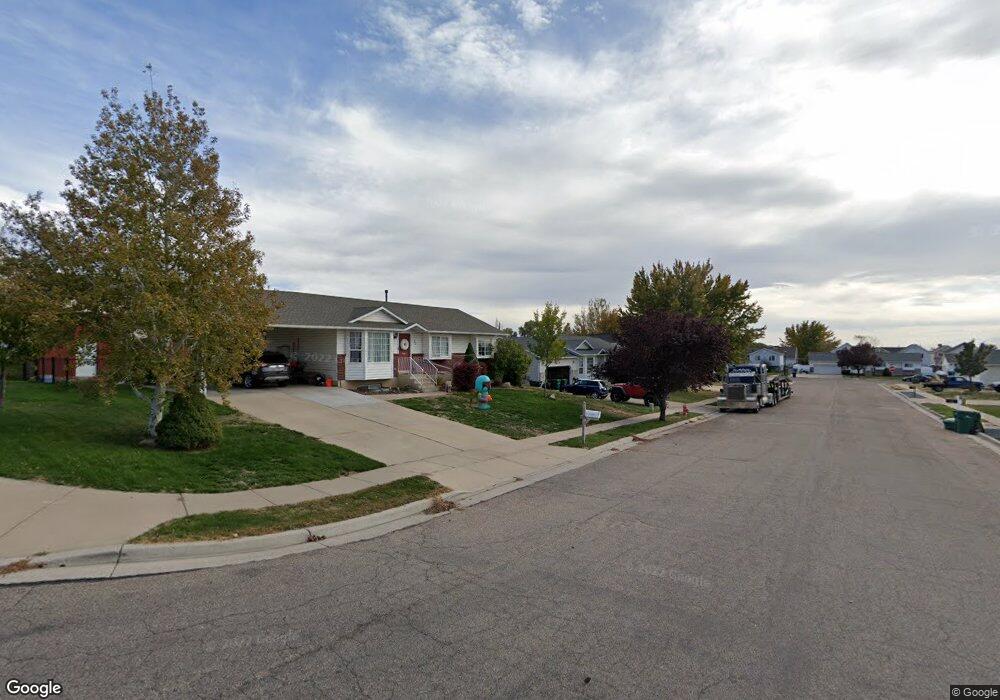
1056 N 300 W Clearfield, UT 84015
Estimated Value: $374,000 - $464,000
5
Beds
2
Baths
1,866
Sq Ft
$229/Sq Ft
Est. Value
About This Home
This home is located at 1056 N 300 W, Clearfield, UT 84015 and is currently estimated at $427,579, approximately $229 per square foot. 1056 N 300 W is a home located in Davis County with nearby schools including Doxey School, Sunset Junior High School, and Northridge High School.
Ownership History
Date
Name
Owned For
Owner Type
Purchase Details
Closed on
Mar 19, 2010
Sold by
Gabbert Nadean Y and Gabbert Jason
Bought by
Gabbert Jason M and Gabbert Nadean Y
Current Estimated Value
Home Financials for this Owner
Home Financials are based on the most recent Mortgage that was taken out on this home.
Original Mortgage
$95,371
Outstanding Balance
$62,835
Interest Rate
4.94%
Mortgage Type
New Conventional
Estimated Equity
$364,744
Purchase Details
Closed on
Oct 6, 2009
Sold by
Young Laverne H
Bought by
Gabbert Nadean Y and Gabbert Jason
Purchase Details
Closed on
Dec 6, 2002
Sold by
Young Laverne H
Bought by
Young Laverne H and Gabbert Nadean Y
Home Financials for this Owner
Home Financials are based on the most recent Mortgage that was taken out on this home.
Original Mortgage
$102,600
Interest Rate
6.06%
Create a Home Valuation Report for This Property
The Home Valuation Report is an in-depth analysis detailing your home's value as well as a comparison with similar homes in the area
Home Values in the Area
Average Home Value in this Area
Purchase History
| Date | Buyer | Sale Price | Title Company |
|---|---|---|---|
| Gabbert Jason M | -- | Equity Title Ins Agency Inc | |
| Gabbert Nadean Y | -- | None Available | |
| Young Laverne H | -- | Heritage West Title Insuranc |
Source: Public Records
Mortgage History
| Date | Status | Borrower | Loan Amount |
|---|---|---|---|
| Open | Gabbert Jason M | $95,371 | |
| Previous Owner | Young Laverne H | $102,600 |
Source: Public Records
Tax History Compared to Growth
Tax History
| Year | Tax Paid | Tax Assessment Tax Assessment Total Assessment is a certain percentage of the fair market value that is determined by local assessors to be the total taxable value of land and additions on the property. | Land | Improvement |
|---|---|---|---|---|
| 2025 | $2,762 | $251,900 | $72,885 | $179,015 |
| 2024 | $2,514 | $229,350 | $69,677 | $159,673 |
| 2023 | $2,363 | $393,000 | $111,447 | $281,553 |
| 2022 | $2,547 | $229,350 | $63,875 | $165,475 |
| 2021 | $2,163 | $306,000 | $68,064 | $237,936 |
| 2020 | $1,912 | $266,000 | $57,289 | $208,711 |
| 2019 | $1,808 | $258,000 | $74,017 | $183,983 |
| 2018 | $1,632 | $228,000 | $59,151 | $168,849 |
| 2016 | $1,430 | $102,685 | $27,963 | $74,722 |
| 2015 | $1,344 | $91,410 | $27,963 | $63,447 |
| 2014 | $1,350 | $93,852 | $28,159 | $65,693 |
| 2013 | -- | $81,921 | $23,265 | $58,656 |
Source: Public Records
Map
Nearby Homes