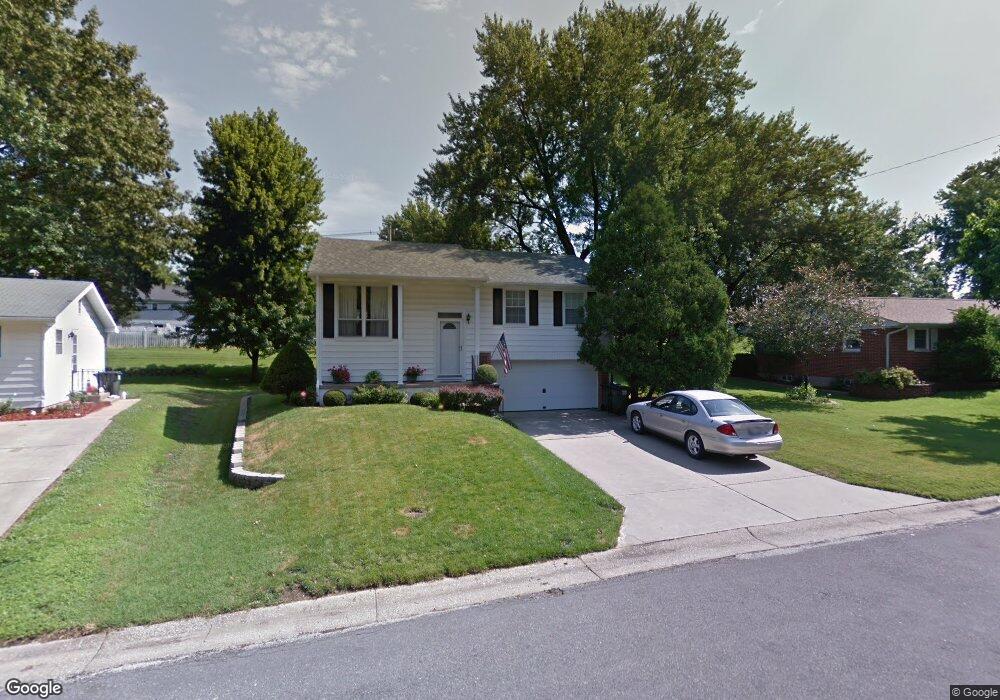
1056 N Rapp Ave Columbia, IL 62236
Estimated Value: $213,624 - $266,000
3
Beds
--
Bath
1,008
Sq Ft
$231/Sq Ft
Est. Value
About This Home
This home is located at 1056 N Rapp Ave, Columbia, IL 62236 and is currently estimated at $232,906, approximately $231 per square foot. 1056 N Rapp Ave is a home located in Monroe County with nearby schools including Columbia Middle School and Columbia High School.
Ownership History
Date
Name
Owned For
Owner Type
Purchase Details
Closed on
Oct 31, 2024
Sold by
Foster Cole A and Foster Rachel A
Bought by
Foster Cole A and Foster Rachel A
Current Estimated Value
Home Financials for this Owner
Home Financials are based on the most recent Mortgage that was taken out on this home.
Original Mortgage
$182,336
Outstanding Balance
$180,479
Interest Rate
6%
Mortgage Type
FHA
Estimated Equity
$52,427
Purchase Details
Closed on
Mar 29, 2021
Sold by
Foster and Karen
Bought by
Foster Cole and Emling Rachel
Home Financials for this Owner
Home Financials are based on the most recent Mortgage that was taken out on this home.
Original Mortgage
$104,800
Interest Rate
2.25%
Mortgage Type
New Conventional
Purchase Details
Closed on
Mar 6, 2020
Sold by
Donald And Barbara Weber Family Trust
Bought by
Foster Craig and Foster Karen
Purchase Details
Closed on
Mar 4, 2020
Sold by
Donald And Barbara Weber Family Trust
Bought by
Foster Craig and Foster Karen
Create a Home Valuation Report for This Property
The Home Valuation Report is an in-depth analysis detailing your home's value as well as a comparison with similar homes in the area
Home Values in the Area
Average Home Value in this Area
Purchase History
| Date | Buyer | Sale Price | Title Company |
|---|---|---|---|
| Foster Cole A | -- | None Listed On Document | |
| Foster Cole A | -- | None Listed On Document | |
| Foster Cole | $131,000 | Columbia Title | |
| Foster Craig | -- | None Listed On Document | |
| Foster Craig | -- | None Listed On Document |
Source: Public Records
Mortgage History
| Date | Status | Borrower | Loan Amount |
|---|---|---|---|
| Open | Foster Cole A | $182,336 | |
| Closed | Foster Cole A | $182,336 | |
| Previous Owner | Foster Cole | $104,800 |
Source: Public Records
Tax History Compared to Growth
Tax History
| Year | Tax Paid | Tax Assessment Tax Assessment Total Assessment is a certain percentage of the fair market value that is determined by local assessors to be the total taxable value of land and additions on the property. | Land | Improvement |
|---|---|---|---|---|
| 2024 | $3,434 | $60,092 | $18,408 | $41,684 |
| 2023 | $3,165 | $51,730 | $17,840 | $33,890 |
| 2022 | $3,161 | $50,820 | $13,710 | $37,110 |
| 2021 | $2,506 | $40,630 | $9,600 | $31,030 |
| 2020 | $2,072 | $40,630 | $9,600 | $31,030 |
| 2019 | $1,888 | $37,760 | $9,600 | $28,160 |
| 2018 | $1,775 | $35,170 | $9,600 | $25,570 |
| 2017 | $1,774 | $36,261 | $9,773 | $26,488 |
| 2016 | $0 | $35,740 | $9,240 | $26,500 |
| 2015 | $1,762 | $35,500 | $9,830 | $25,670 |
| 2014 | $1,440 | $31,320 | $9,830 | $21,490 |
| 2012 | -- | $31,880 | $8,330 | $23,550 |
Source: Public Records
Map
Nearby Homes
- 817 N Briegel St
- 1 Meadowridge E
- 527 Fairfax Dr
- 000 Young Or Divers
- 523 W Bottom Ave
- 6 Ogle Estates
- 3 Ogle Estates
- 9700 Route 3
- 209 Heritage St
- 1 Ogle Estates
- 127 S Rapp Ave
- 3 Justin Dr
- 214 E Market St
- 212 S Columbia St
- 1374 Walnut Ridge Dr
- 1382 Walnut Ridge Dr
- 1379 Walnut Ridge Dr
- 208 W Washington St
- 1391 Walnut Ridge Dr
- 221 Tower Hill Dr
- 1102 N Rapp Ave
- 1048 N Rapp Ave
- 1108 N Rapp Ave
- 1051 N Main St
- 1041 N Main St
- 1055 N Rapp Ave
- 1105 N Rapp Ave
- 1112 N Rapp Ave
- 1105 N Main St
- 1031 N Main St
- 205 Parkmanor Dr
- 1113 N Rapp Ave
- 1111 N Main St
- 1036 N Rapp Ave
- 117 W Temple St
- 214 Parkmanor Dr
- 1119 N Rapp Ave
- 1115 N Main St
- 1035 N Rapp Ave
- 1021 N Main St