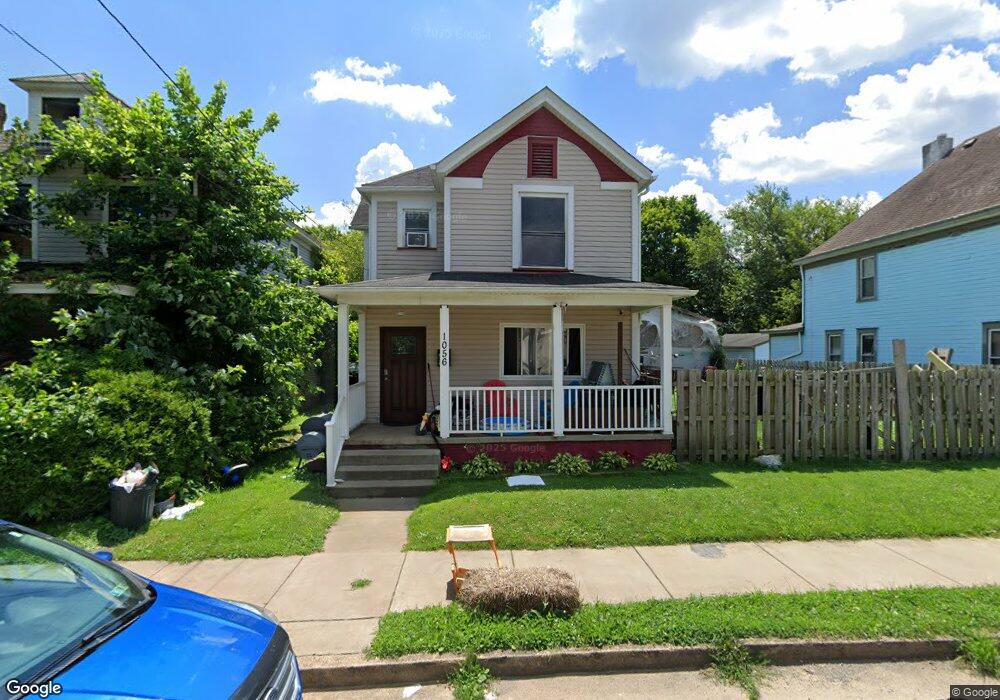
1056 Saint George St East Liverpool, OH 43920
Estimated Value: $47,000 - $80,000
3
Beds
1
Bath
1,416
Sq Ft
$47/Sq Ft
Est. Value
About This Home
This home is located at 1056 Saint George St, East Liverpool, OH 43920 and is currently estimated at $65,976, approximately $46 per square foot. 1056 Saint George St is a home located in Columbiana County with nearby schools including Westgate Middle School, LaCroft Elementary School, and East Liverpool High School.
Ownership History
Date
Name
Owned For
Owner Type
Purchase Details
Closed on
Apr 12, 2012
Sold by
Croxall Deloris and Estate Of Ernie Lee Krafft
Bought by
Wright Hayden
Current Estimated Value
Home Financials for this Owner
Home Financials are based on the most recent Mortgage that was taken out on this home.
Original Mortgage
$1,800
Outstanding Balance
$1,243
Interest Rate
3.91%
Mortgage Type
Unknown
Estimated Equity
$64,733
Purchase Details
Closed on
Jan 29, 2003
Sold by
Love Terrence J
Bought by
Finley Shannon L
Purchase Details
Closed on
Oct 30, 1998
Sold by
Johnson Traci Humphrey
Bought by
Perry Robyn
Purchase Details
Closed on
Jun 12, 1995
Sold by
Smith Richard A
Bought by
Love Traci H Johnson and Love Terrence J
Purchase Details
Closed on
Jan 25, 1994
Sold by
Smith Richard Allen
Bought by
Smith Richard Allen and Smith Bet
Create a Home Valuation Report for This Property
The Home Valuation Report is an in-depth analysis detailing your home's value as well as a comparison with similar homes in the area
Home Values in the Area
Average Home Value in this Area
Purchase History
| Date | Buyer | Sale Price | Title Company |
|---|---|---|---|
| Wright Hayden | $9,000 | Attorney | |
| Finley Shannon L | $5,000 | -- | |
| Findley Shannon L | $5,000 | -- | |
| Perry Robyn | $1,000 | -- | |
| Love Traci H Johnson | $25,000 | -- | |
| Smith Richard Allen | $11,300 | -- |
Source: Public Records
Mortgage History
| Date | Status | Borrower | Loan Amount |
|---|---|---|---|
| Open | Wright Hayden | $1,800 | |
| Open | Wright Hayden | $14,400 |
Source: Public Records
Tax History Compared to Growth
Tax History
| Year | Tax Paid | Tax Assessment Tax Assessment Total Assessment is a certain percentage of the fair market value that is determined by local assessors to be the total taxable value of land and additions on the property. | Land | Improvement |
|---|---|---|---|---|
| 2024 | $787 | $17,820 | $390 | $17,430 |
| 2023 | $1,075 | $17,820 | $390 | $17,430 |
| 2022 | $732 | $17,820 | $390 | $17,430 |
| 2021 | $636 | $14,180 | $350 | $13,830 |
| 2020 | $355 | $7,910 | $350 | $7,560 |
| 2019 | $355 | $7,910 | $350 | $7,560 |
| 2018 | $343 | $7,180 | $320 | $6,860 |
| 2017 | $361 | $7,180 | $320 | $6,860 |
| 2016 | $339 | $6,930 | $280 | $6,650 |
| 2015 | $339 | $6,930 | $280 | $6,650 |
| 2014 | $335 | $6,930 | $280 | $6,650 |
Source: Public Records
Map
Nearby Homes
- 1045 Saint George St
- 1030 Saint George St
- 1013 Saint George St
- 1147 Ohio Ave
- 936 Saint George St
- 534 1st St
- 1259 Erie St
- 507 Wedgewood St
- 636 River Rd
- 1575 Globe St
- 1615 Montrose St
- 915 Phoenix Ave
- 908 Phoenix Ave
- 215 Alpine Way
- 20 Phaeton Ave
- 509 Pyramus Rd
- 7 Teaberry Dr
- TBD Orion
- 2535 Park Way
- 12 Lotus Ave
- 1058 Saint George St
- 1054 Saint George St
- 1060 Saint George St
- 1048 Saint George St
- 1072 Saint George St
- 1038 Saint George St
- 1055 Saint George St
- 1063 Ohio Ave
- 1070 Saint George St
- 1061 Ohio Ave
- 1057 Saint George St
- 1061 Saint George St
- 1045 Ohio Ave
- 1067 Ohio Ave
- 1063 Saint George St
- 1063 Saint George St
- 1051 Saint George St
- 1036 Saint George St
- 1069 Saint George St Unit 1071
- 1071 Ohio Ave