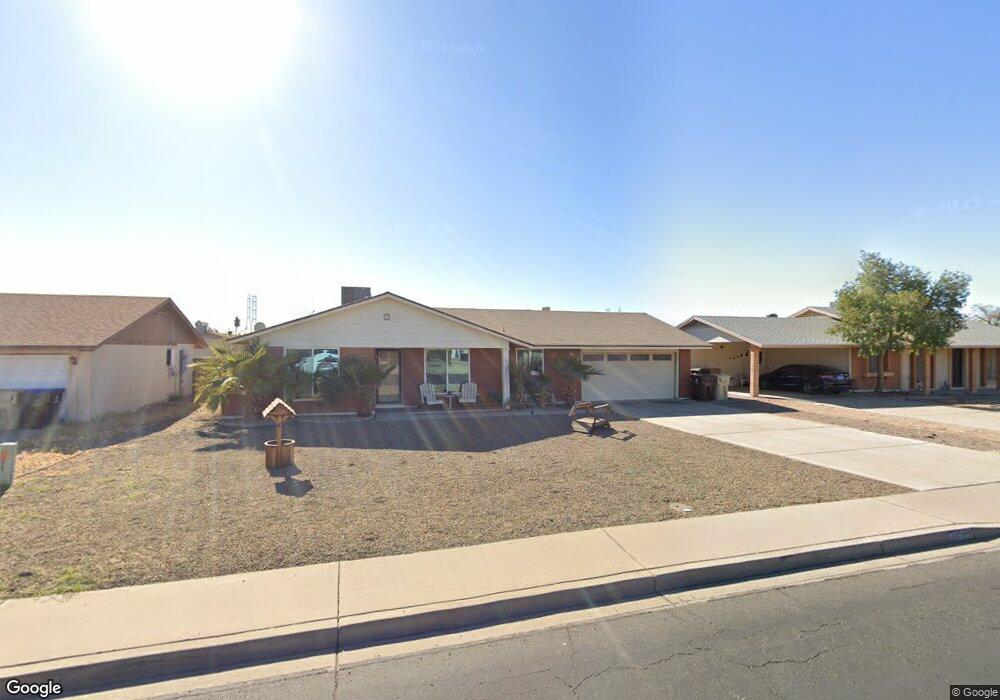
10565 W Butler Dr Peoria, AZ 85345
Estimated Value: $308,000 - $336,000
2
Beds
2
Baths
1,386
Sq Ft
$233/Sq Ft
Est. Value
About This Home
This home is located at 10565 W Butler Dr, Peoria, AZ 85345 and is currently estimated at $323,142, approximately $233 per square foot. 10565 W Butler Dr is a home located in Maricopa County with nearby schools including Country Meadows Elementary School, Raymond S. Kellis, and Brighton Charter School.
Ownership History
Date
Name
Owned For
Owner Type
Purchase Details
Closed on
Jun 16, 2009
Sold by
Bank Of New York
Bought by
Lyster Steve E
Current Estimated Value
Home Financials for this Owner
Home Financials are based on the most recent Mortgage that was taken out on this home.
Original Mortgage
$84,588
Outstanding Balance
$55,763
Interest Rate
5.59%
Mortgage Type
FHA
Estimated Equity
$267,379
Purchase Details
Closed on
Sep 9, 2008
Sold by
Baten John
Bought by
The Bank Of New York and Cit Mortgage Loan Trust 2007-1
Purchase Details
Closed on
Aug 16, 2005
Sold by
Zerfas Sally
Bought by
Batten John
Purchase Details
Closed on
Aug 21, 2002
Sold by
Martinez Tranquilino and Martinez Dionelia
Bought by
Batten Karen Lou
Home Financials for this Owner
Home Financials are based on the most recent Mortgage that was taken out on this home.
Original Mortgage
$107,315
Interest Rate
6.29%
Mortgage Type
FHA
Create a Home Valuation Report for This Property
The Home Valuation Report is an in-depth analysis detailing your home's value as well as a comparison with similar homes in the area
Home Values in the Area
Average Home Value in this Area
Purchase History
| Date | Buyer | Sale Price | Title Company |
|---|---|---|---|
| Lyster Steve E | $86,150 | The Talon Group Mesa Springs | |
| The Bank Of New York | $100,087 | None Available | |
| Batten John | -- | -- | |
| Batten Karen Lou | $109,000 | North American Title Co |
Source: Public Records
Mortgage History
| Date | Status | Borrower | Loan Amount |
|---|---|---|---|
| Open | Lyster Steve E | $84,588 | |
| Previous Owner | Batten Karen Lou | $107,315 |
Source: Public Records
Tax History Compared to Growth
Tax History
| Year | Tax Paid | Tax Assessment Tax Assessment Total Assessment is a certain percentage of the fair market value that is determined by local assessors to be the total taxable value of land and additions on the property. | Land | Improvement |
|---|---|---|---|---|
| 2025 | $752 | $9,934 | -- | -- |
| 2024 | $762 | $9,461 | -- | -- |
| 2023 | $762 | $24,630 | $4,920 | $19,710 |
| 2022 | $746 | $18,620 | $3,720 | $14,900 |
| 2021 | $798 | $16,780 | $3,350 | $13,430 |
| 2020 | $806 | $15,770 | $3,150 | $12,620 |
| 2019 | $780 | $14,050 | $2,810 | $11,240 |
| 2018 | $754 | $12,470 | $2,490 | $9,980 |
| 2017 | $754 | $11,010 | $2,200 | $8,810 |
| 2016 | $741 | $9,980 | $1,990 | $7,990 |
| 2015 | $697 | $9,250 | $1,850 | $7,400 |
Source: Public Records
Map
Nearby Homes
- 10512 W Butler Dr
- 10603 W Ruth Ave
- 8435 N 104th Dr Unit 3
- 10516 W Griswold Rd
- 10625 W Alice Ave
- 8161 N 107th Ave Unit 109
- 10512 W Ruth Ave
- 10621 W Lawrence Ln
- 8566 N 108th Ln
- 8800 N 107th Ave Unit 17
- 8800 N 107th Ave Unit 19
- 8131 N 107th Ave Unit 74
- 8140 N 107th Ave Unit 125
- 8140 N 107th Ave Unit 281
- 8140 N 107th Ave Unit 287
- 8803 N 105th Dr
- 8101 N 107th Ave Unit 23
- 10620 W Northern Ave Unit 5
- 8301 N 103rd Ave Unit 177
- 8301 N 103rd Ave Unit 53
- 10559 W Butler Dr
- 10571 W Butler Dr
- 10566 W Echo Ln
- 10560 W Echo Ln
- 10553 W Butler Dr
- 10554 W Echo Ln
- 10610 W Butler Dr
- 10616 W Butler Dr
- 10604 W Butler Dr
- 10547 W Butler Dr
- 10622 W Butler Dr
- 10608 W Echo Ln
- 10552 W Butler Dr
- 10548 W Echo Ln
- 10565 W Echo Ln
- 10559 W Echo Ln
- 10571 W Echo Ln
- 10628 W Butler Dr
- 10609 W Seldon Ln
- 10607 W Butler Dr