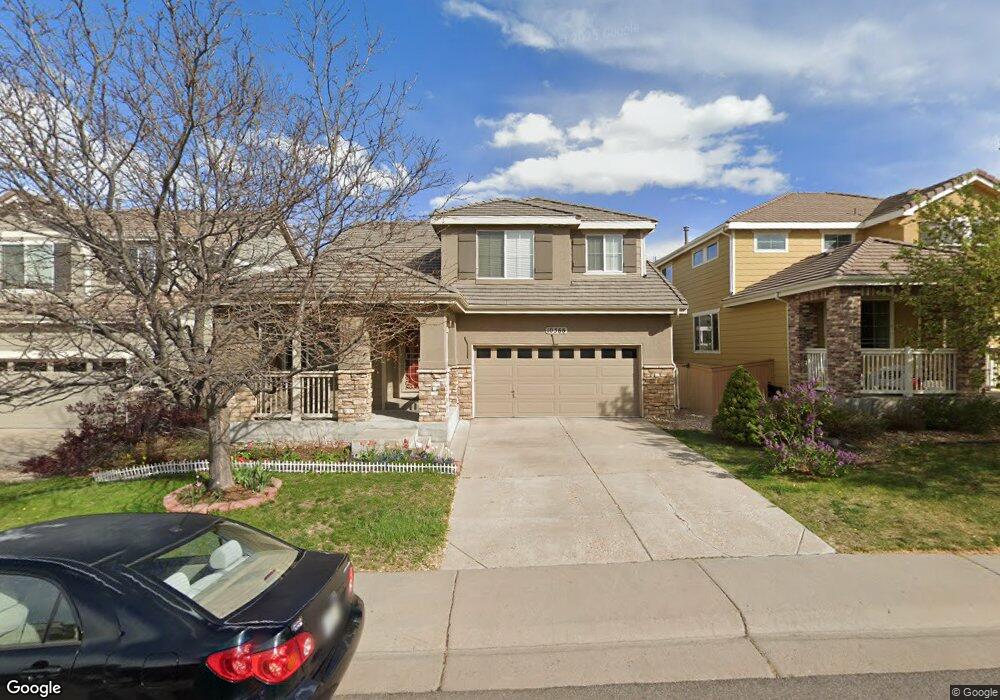
10566 Laurelglen Cir Highlands Ranch, CO 80130
Southridge NeighborhoodEstimated Value: $636,873 - $786,000
3
Beds
3
Baths
2,135
Sq Ft
$321/Sq Ft
Est. Value
About This Home
This home is located at 10566 Laurelglen Cir, Highlands Ranch, CO 80130 and is currently estimated at $685,468, approximately $321 per square foot. 10566 Laurelglen Cir is a home located in Douglas County with nearby schools including Heritage Elementary School, Mountain Ridge Middle School, and Mountain Vista High School.
Ownership History
Date
Name
Owned For
Owner Type
Purchase Details
Closed on
Jun 27, 2015
Sold by
Vo Lien and Vo Ninh
Bought by
Vo Lien and Vo Ninh
Current Estimated Value
Purchase Details
Closed on
Dec 19, 2003
Sold by
Vo Ninh D
Bought by
Vo Ninh D and Vo Linh D
Purchase Details
Closed on
Jul 23, 2003
Sold by
Richmond American Homes Of Colorado Inc
Bought by
Vo Ninh D
Home Financials for this Owner
Home Financials are based on the most recent Mortgage that was taken out on this home.
Original Mortgage
$131,100
Outstanding Balance
$55,443
Interest Rate
5.19%
Mortgage Type
Unknown
Estimated Equity
$630,025
Purchase Details
Closed on
Jul 15, 2003
Sold by
Richmond American Homes Of Colo Inc Attn
Bought by
Vo Ninh D
Home Financials for this Owner
Home Financials are based on the most recent Mortgage that was taken out on this home.
Original Mortgage
$131,100
Outstanding Balance
$55,443
Interest Rate
5.19%
Mortgage Type
Unknown
Estimated Equity
$630,025
Purchase Details
Closed on
Dec 15, 2000
Sold by
Shea Homes Lp
Bought by
Richmond American Homes Of Colo Inc
Create a Home Valuation Report for This Property
The Home Valuation Report is an in-depth analysis detailing your home's value as well as a comparison with similar homes in the area
Home Values in the Area
Average Home Value in this Area
Purchase History
| Date | Buyer | Sale Price | Title Company |
|---|---|---|---|
| Vo Lien | -- | None Available | |
| Vo Ninh D | -- | -- | |
| Vo Ninh D | $262,341 | -- | |
| Vo Ninh D | $262,300 | -- | |
| Richmond American Homes Of Colo Inc | $11,306,000 | -- |
Source: Public Records
Mortgage History
| Date | Status | Borrower | Loan Amount |
|---|---|---|---|
| Open | Vo Ninh D | $131,100 |
Source: Public Records
Tax History Compared to Growth
Tax History
| Year | Tax Paid | Tax Assessment Tax Assessment Total Assessment is a certain percentage of the fair market value that is determined by local assessors to be the total taxable value of land and additions on the property. | Land | Improvement |
|---|---|---|---|---|
| 2024 | $3,991 | $46,030 | $10,420 | $35,610 |
| 2023 | $3,984 | $46,030 | $10,420 | $35,610 |
| 2022 | $2,985 | $32,670 | $7,650 | $25,020 |
| 2021 | $3,104 | $32,670 | $7,650 | $25,020 |
| 2020 | $3,001 | $32,360 | $6,710 | $25,650 |
| 2019 | $3,012 | $32,360 | $6,710 | $25,650 |
| 2018 | $2,676 | $28,310 | $6,130 | $22,180 |
| 2017 | $2,436 | $28,310 | $6,130 | $22,180 |
| 2016 | $2,405 | $27,430 | $5,510 | $21,920 |
| 2015 | $2,457 | $27,430 | $5,510 | $21,920 |
| 2014 | $2,189 | $22,570 | $6,930 | $15,640 |
Source: Public Records
Map
Nearby Homes
- 10547 Laurelglen Cir
- 10653 Briarglen Cir
- 4656 Ketchwood Cir
- 5001 Laurelglen Ln
- 10580 Parkington Ln Unit B
- 4287 Brookwood Place
- 10360 Tracewood Ct
- 10588 Parkington Ln Unit 39A
- 10896 Valleybrook Cir
- 3851 Stonebrush Dr Unit 11B
- 4965 Huntwick Place
- 10535 Ashfield St
- 3853 Charterwood Dr
- 10582 Ashfield St
- 10832 Hickory Ridge Ln
- 4967 Waldenwood Dr
- 11036 Glengate Cir
- 10358 Kelliwood Way
- 4749 Waldenwood Dr
- 4907 Fenwood Dr
- 10568 Laurelglen Cir
- 10564 Laurelglen Cir
- 10540 Laurelglen Cir
- 10570 Laurelglen Cir
- 10542 Laurelglen Cir
- 10538 Laurelglen Cir
- 10536 Laurelglen Cir
- 10572 Laurelglen Cir
- 10563 Laurelglen Cir
- 10567 Laurelglen Cir
- 10565 Laurelglen Cir
- 10561 Laurelglen Cir
- 10569 Laurelglen Cir
- 10555 Laurelglen Cir
- 10553 Laurelglen Cir
- 10534 Laurelglen Cir
- 10551 Laurelglen Cir
- 10571 Laurelglen Cir
- 10549 Laurelglen Cir
- 10573 Laurelglen Cir